What did Americans think AI owed art and vice-versa? Let’s find out in this chapter.
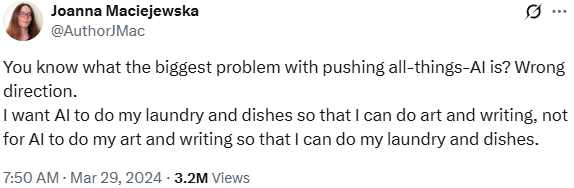
We can start with a tweet from Joanna Maciejewska that went viral:
I want AI to do my laundry and dishes so that I can do art and writing, not for AI to do my art and writing so that I can do my laundry and dishes. - Joanna Maciejewska
This pithy tweet echoed Americans’ primary fear regarding AI in 2023: those controlling AI development were greedy, selfish or irresponsible. (See Figure 4.1.) Maciejewska’s point - that AI should automate human drudgery to free up time for human creativity - seemed obvious to many, but the opposite seemed to be happening.
AI products were generating images, videos and even fan fiction stories. Some people were amazed and amused, while others were disgusted and repelled. To measure the relative distribution of Americans’ opinions about AI and art, I ran a short survey.
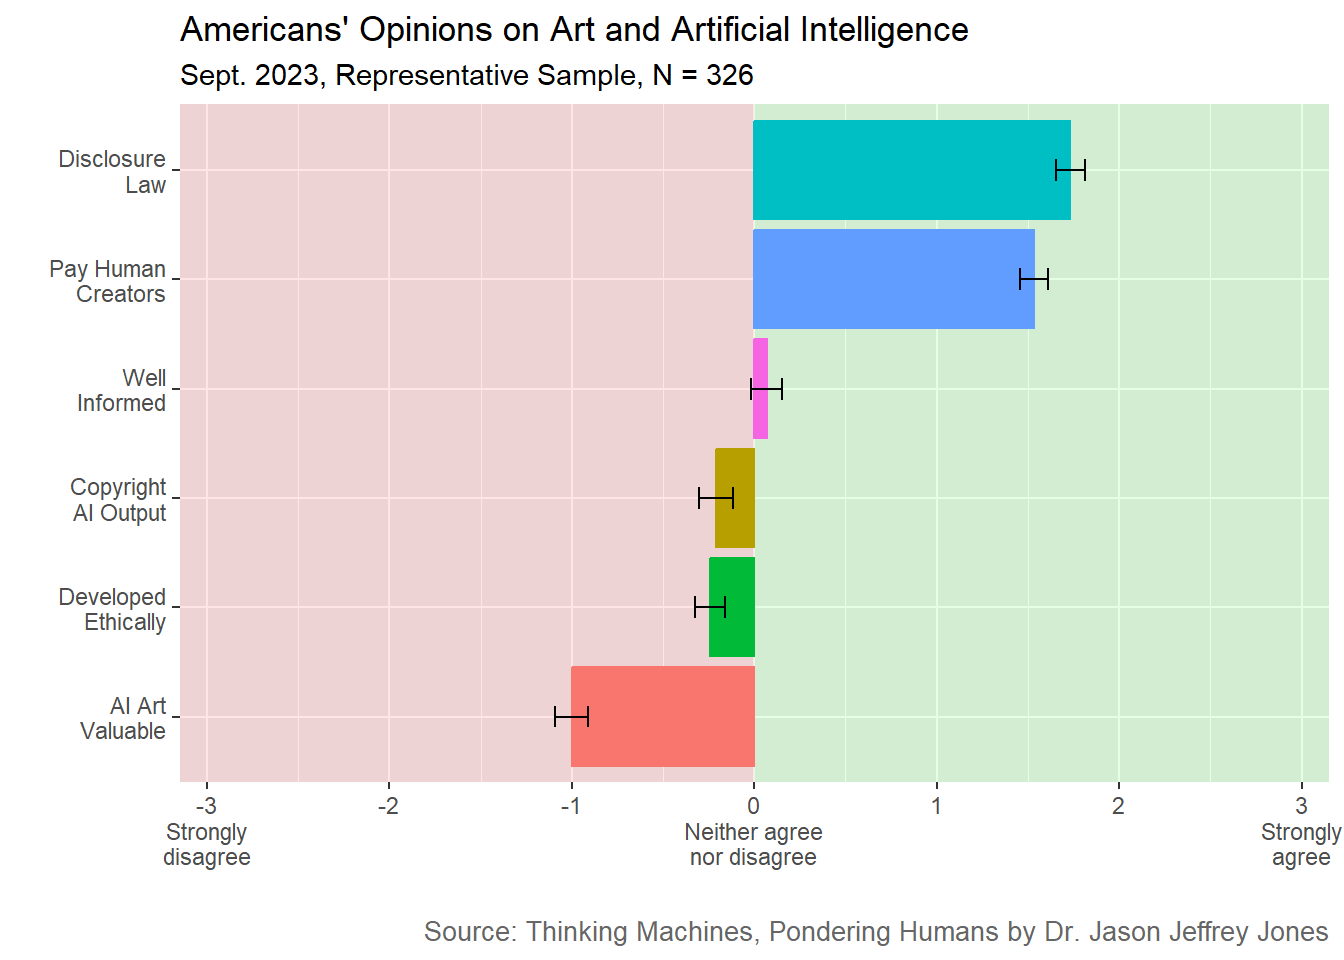
Americans wanted compensation for human artists whose work had been used for training and mandatory disclosure when AI was used to create art. See Figure 5.1.
Americans did not find AI art valuable. They opposed AI art receiving copyright protection, and they disagreed that AI art and writing generators were developed in an ethical manner.
Code
library(tidyverse)library(scales)# The file ai-art-2023-wide-correlates.csv contains responses from a US representative sample of 326 respondents.# Download the file from a public Open Science Framework repository at https://osf.io/download/xr6ku/responses =read_csv("data/ai-art-2023-wide-correlates.csv")# Select columns and pivot.artResponses = responses %>%select(Developed_Ethically:Well_Informed) %>%pivot_longer(cols =everything(),names_to ="Item",names_transform =list(Item =~gsub("_", " ", .)),values_to ="Response")# Set up some options for the figure.art_summary_2023_caption =paste0("Source: Thinking Machines, Pondering Humans by Dr. Jason Jeffrey Jones")# Summary figureartResponses %>%group_by(Item) %>%summarise(Mean_Response =mean(Response, na.rm =TRUE),sd =sd(Response, na.rm =TRUE),n =sum(!is.na(Response)),se = sd /sqrt(n),error_low = Mean_Response - se,error_high = Mean_Response + se ) %>%ggplot(aes(x =reorder(Item, Mean_Response), y = Mean_Response, color = Item, fill = Item)) +# Add green and red shading to demarcate agree vs disagree.annotate(geom="rect", xmin=-Inf, xmax=Inf, ymin=0.0, ymax=Inf, fill="green", alpha=0.1) +annotate(geom="rect", xmin=-Inf, xmax=Inf, ymin=-Inf, ymax=0.0, fill="red", alpha=0.1) +# Annotations go first, so data elements are layered on top.geom_col() +geom_errorbar(aes(ymin = error_low, ymax = error_high), color="black", width=0.2) +ggtitle("Americans' Opinions on Art and Artificial Intelligence", "Sept. 2023, Representative Sample, N = 326") +xlab("") +ylab("") +# Apply labels with wrapping.scale_x_discrete(labels =label_wrap(10)) +# Set color and fill values.# Force y scale to -3 through 3. Put numbers on y-axis. Add low and high labels.scale_y_continuous(limits =c(-3,3), breaks =-3:3, labels =c("-3\nStrongly\ndisagree", "-2", "-1", "0\nNeither agree\nnor disagree", "1", "2", "3\nStrongly\nagree"), expand=expansion(mult =0.025)) +labs(caption = art_summary_2023_caption) +theme(plot.caption =element_text(size=10, color ="#666666")) +# The legend has only redundant information. Get rid of it.theme(legend.position ="none") +coord_flip()
Figure 5.1: Art and AI survey results. Plotted is mean response on a 7-point Likert scale from Strongly disagree to Strongly agree. Black bars are +/- one standard error.
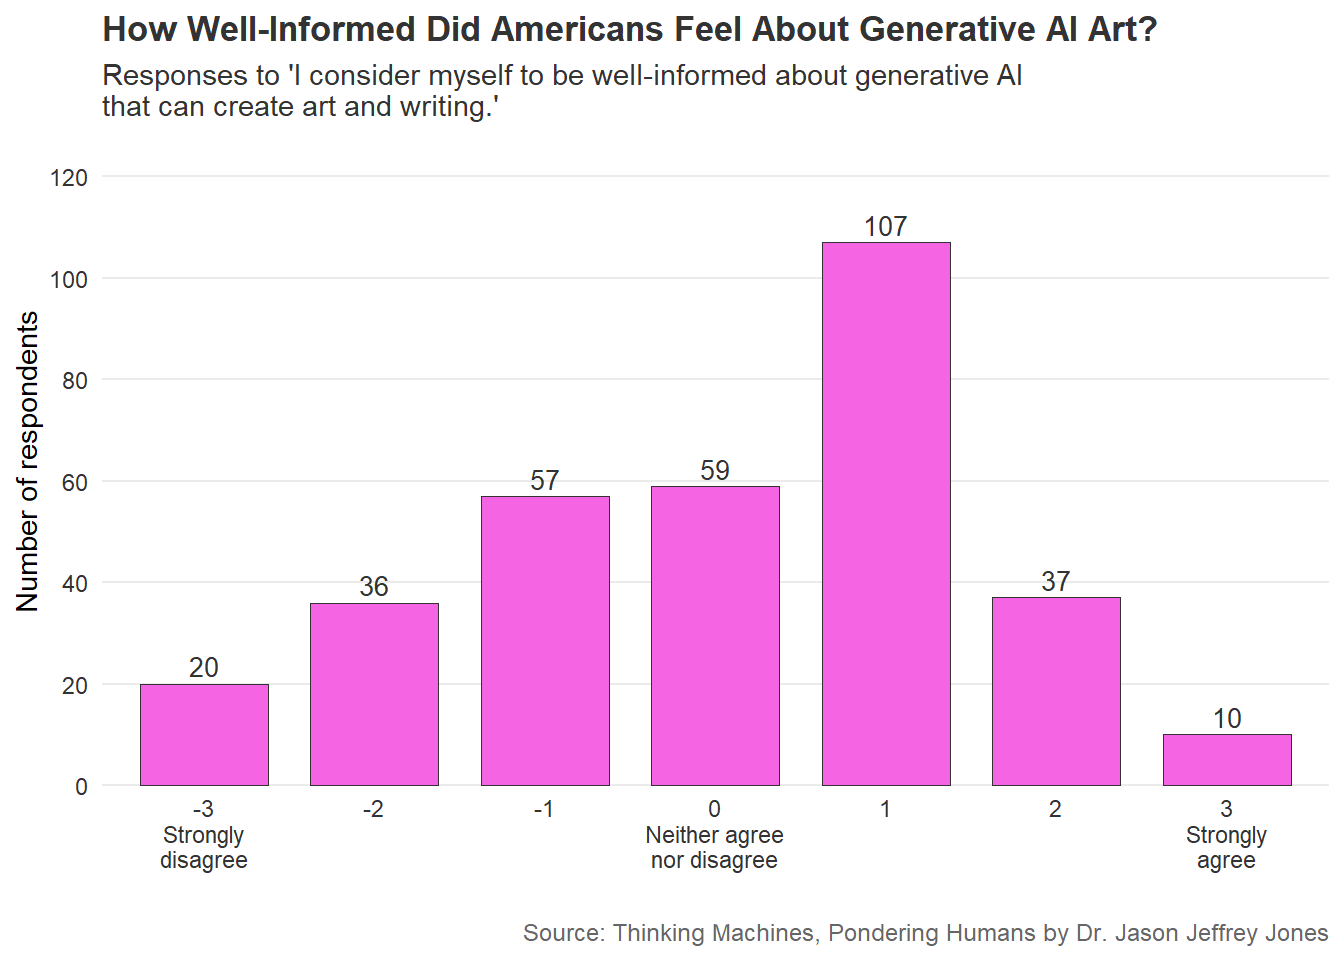
On average, respondents were hesitant to claim they were particularly well-informed or uninformed about generative AI. See the distribution in Figure 5.2.
Code
well_informed_counts <- responses %>%count(Well_Informed, name ="n") %>%complete(Well_Informed =-3:3, fill =list(n =0)) %>%mutate(response_label =factor( Well_Informed,levels =-3:3,labels =c("-3\nStrongly\ndisagree","-2","-1","0\nNeither agree\nnor disagree","1","2","3\nStrongly\nagree" ) ) )well_informed_counts %>%ggplot(aes(x = response_label, y = n)) +geom_col(fill ="#F564E3",color ="#333333",linewidth =0.35,width =0.75 ) +geom_text(aes(label = n),vjust =-0.35,size =3.5,color ="#333333" ) +scale_y_continuous(limits =c(0, max(well_informed_counts$n) *1.15),breaks =pretty_breaks(),expand =expansion(mult =c(0, 0.04)) ) +labs(title ="How Well-Informed Did Americans Feel About Generative AI Art?",subtitle ="Responses to 'I consider myself to be well-informed about generative AI\nthat can create art and writing.'",x ="",y ="Number of respondents",caption ="Source: Thinking Machines, Pondering Humans by Dr. Jason Jeffrey Jones" ) +theme_minimal(base_size =11) +theme(panel.grid.major.x =element_blank(),panel.grid.minor =element_blank(),axis.text.x =element_text(color ="#333333"),axis.text.y =element_text(color ="#333333"),plot.title =element_text(face ="bold", color ="#333333"),plot.subtitle =element_text(color ="#333333"),plot.caption =element_text(size =9, color ="#666666") )
Figure 5.2: Distribution of responses: ‘I consider myself to be well-informed about generative AI that can create art and writing.’
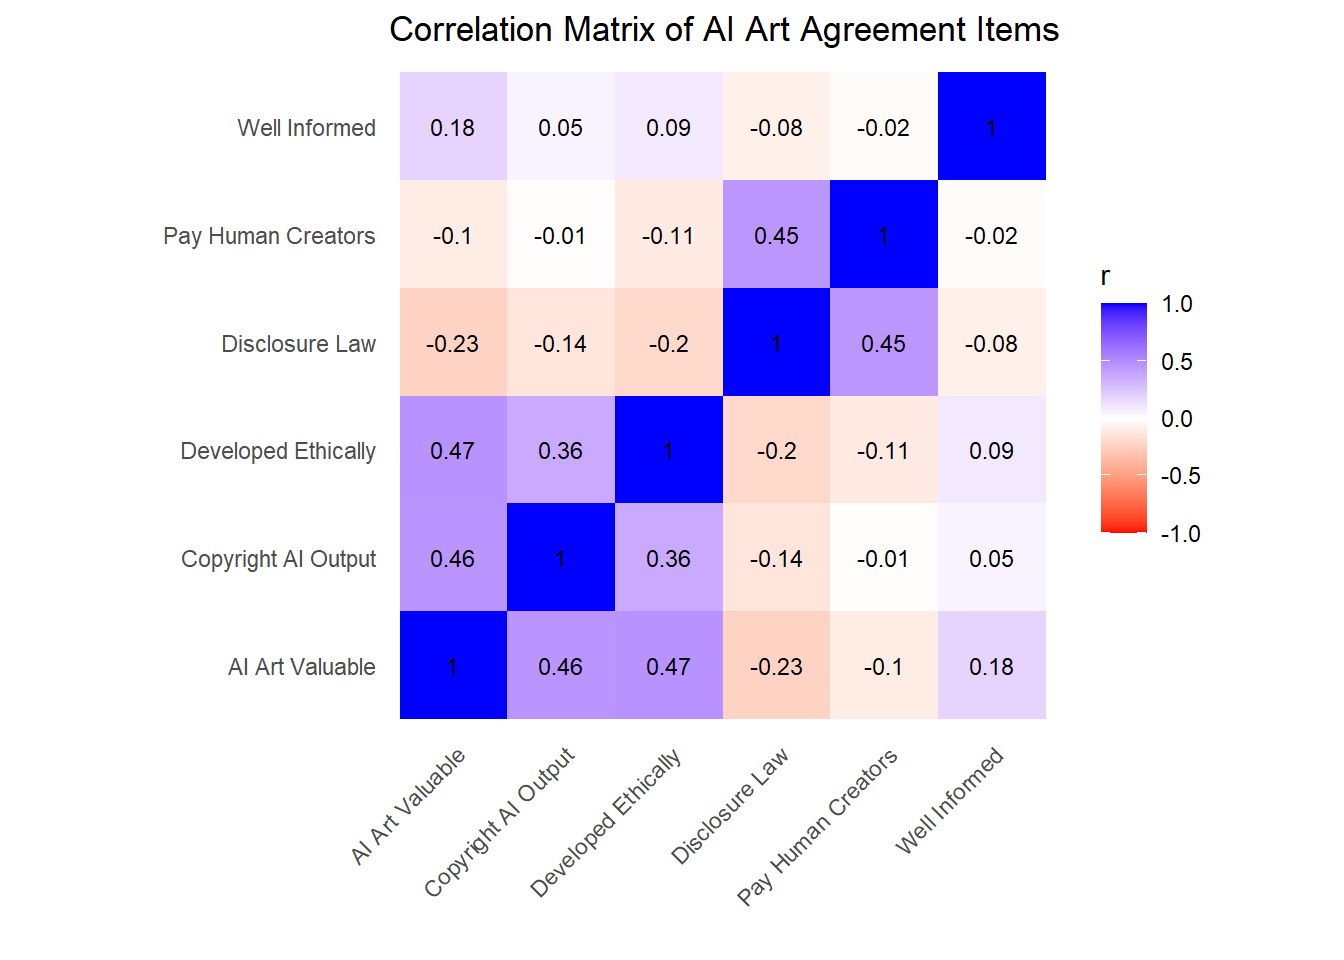
Still, we have enough data to estimate the association between the other attitudes and how well-informed each respondent reports themselves to be. While we’re looking for associations, let’s examine the correlation matrix of all the agreement items.
Figure 5.3: Correlation in agreement for Art and AI survey responses. Note the two blue blocks of higher, positive correlation. Consider how being ‘well informed’ (by self-report) related to each block.
Two blocks jump out. First, those that agree disclosure of generative AI use should be mandated by law also agreed that human creators of works used in training should be paid compensation. Second, finding AI art valuable aligned with believing one should be able to copyright AI output and that generative AI was developed ethically.
Interestingly, one’s level of self-assessed information was only weakly associated with other items. Those considering themselves well-informed were slightly more aligned with the second, pro-AI art block.
5.2 Survey Items, Respondents and Costs
5.2.1 Survey Items
Respondents were told: In all of the following, AI stands for artificial intelligence.
Then, respondents were asked: How much do you agree or disagree with each of the following statements?
These statements were presented in random order:
I believe that AI art and writing generators have been developed in an ethical manner.
Disclosing when a piece of art or writing has been generated by AI should be required by law.
Human creators of artwork and writing that were included in AI training data should be paid compensation.
Art and writing created by an AI is just as valuable as art or writing created by a human.
Individuals and companies should be able to copyright art and writing created by an AI.
I consider myself to be well-informed about generative AI that can create art and writing.
Respondents chose one of seven points, ranging from Strongly disagree to Strongly agree.
5.2.2 Respondents
Respondents were recruited through Prolific Academic. I requested a representative sample of 325 American adults. Specifically, I chose the option “USA, Factors: Sex, Age, Ethnicity (Simplified US Census).”
The study was run once September 27-29, 2023.
To demonstrate the demographic coverage, below I provide the Sex and Age crosstab:
Code
library(knitr)# Bin ages.demosTable2023Art = responses %>%rename(Age_Raw = Age) %>%select(Sex, Age_Raw)demosTable2023Art = demosTable2023Art %>%mutate(Age ="UNKNOWN" ) %>%mutate(Age =if_else(Age_Raw >=18& Age_Raw <25, "18-24", Age) ) %>%mutate(Age =if_else(Age_Raw >=25& Age_Raw <35, "25-34", Age) ) %>%mutate(Age =if_else(Age_Raw >=35& Age_Raw <45, "35-44", Age) ) %>%mutate(Age =if_else(Age_Raw >=45& Age_Raw <55, "45-54", Age) ) %>%mutate(Age =if_else(Age_Raw >=55& Age_Raw <65, "55-64", Age) ) %>%mutate(Age =if_else(Age_Raw >=65, "65+", Age) )# Generate percentage per demographic bin for each survey sample.demosTable2023Art = demosTable2023Art %>%filter(!is.na(Sex), !is.na(Age)) %>%group_by(Sex, Age) %>%summarise(groupN =n() ) %>%# Add totalN.ungroup() %>%mutate(totalN =sum(groupN) ) %>%# Now we can divide across each row to calculate a percentage.mutate(percent =round(100* groupN / totalN, 0) ) %>%select(-totalN)kable(demosTable2023Art, format ="markdown")
Table 5.1
Sex
Age
groupN
percent
Female
18-24
11
3
Female
25-34
36
11
Female
35-44
34
10
Female
45-54
23
7
Female
55-64
39
12
Female
65+
26
8
Male
18-24
18
6
Male
25-34
32
10
Male
35-44
35
11
Male
45-54
22
7
Male
55-64
31
10
Male
65+
19
6
5.2.3 Costs
The survey took 2 minutes. Each respondent was paid $0.32. Thus, the total of payments to respondents was $104 = 325 * $0.32.
Prolific Academic charged a Service fee equal to 33% of respondent payments. This totaled $34.68.
During this time, Prolific waived the Representative sample fee.
R code for analysis and visualization is embedded above (some formats) or available at TODO GITHUB/ZENODO.
5.4 Summary and What’s Next
On average, in 2023, Americans were not impressed or enthusiastic about generative AI’s forays into art. They wanted protections for humans: payment for human authors and artists whose works were used for training and legally mandated labeling of AI-generated art and writing.
As of this writing in May 2026, neither of those things have happened. Instead, there are endless worry pieces (and some pure moral panic) about AI slop. Internet users constantly brand each other’s words with the scarlet AI.
5.4.1 An aside on bot labeling
In my opinion, when social media platforms (especially Twitter) opened their APIs to developers, they should have made and enforced a simple, bright-line rule: Bots are welcome but must be labelled as such. The platforms lost trust by not satisfying a simple demand: people want to know when they are talking to a bot.
People don’t mind bots. They ask their smart speakers for the weather forecast. They want a bot to alert them when tickets to their favorite band’s concert go on sale. Millions of users pay for ChatGPT, and others form deep relationships with chatbots.
What people don’t want is to be tricked. When you can’t tell whether an account is a person, spammer, catfisher, or propaganda bot, one loses trust and interest. This accounts for much of the toxicity of social media platforms as they exist today.
AI providers are taking steps to watermark their generated text, images and videos. This will fuel an arms race of tools to remove the watermarks and counter-tools to detect watermark removal. A simple, enforced, bright-line rule would give people what they want: the confidence that they know whether a work was human generated or AI generated.
5.4.2 The AI Art Appreciators
One block of Americans appreciated AI art. They wished to admit AI creators to the system: to see their work as valuable and grant them copyright protection. This group of respondents also was more willing to grant the assumption that AI art and writing generators had been developed ethically.
This group also did not get what wanted. The US approach to copyrighting AI work is confused and in flux (inchoate, charitably). When an AI generated work wins an artistic competition, the modal reaction is to consider that fraud rather than achievement.
5.4.3 What’s Next
This chapter was fun. The next chapter is work. We will consider two AI attitude scales. By scale, I mean a survey formally developed by experts with the goal of measuring a latent construct. The construct, in our case, is attitude toward AI, or how positive or negative one feels toward AI.
I identified two frequently-used scales and delivered them simultaneously to American adult samples. From the results, we’ll learn the answers to these questions: Is it good and right to think there is a single measurable thing we would call attitude toward AI? Do both scales measure that attitude toward AI thing? Granted that we want to keep measuring attitude toward AI, which single item is the most efficient for measurement?