Did artificial intelligence worry Americans? This chapter will explore some general and specific concerns with two waves of survey data from 2023 and 2024.
Americans certainly appeared worried. In 2021, 37% said they were more concerned than excited about increased use of AI. (Compare to 18% who reported being more excited than concerned.) By 2025, the excited camp had shrunk to 10%, while the concerned camp grew to 50%. These estimates come from excellent survey research from Pew Research Center.
Perhaps it just makes sense to say one is “more concerned than excited” about a new and rapidly changing technology, but one doesn’t actually worry too much about it. Saying you are “more concerned” may reflect a social desirability bias; it makes one sound sober and discerning.
Let’s explore in a different way the level of worry Americans felt. Then, we’ll get more granular and compare worry directed toward specific AI applications. Continuing down that path, we’ll compare AI to other developing technologies. Next, we’ll ask whether worry resides particularly in those who considered themselves informed. Finally, we will see how feelings about technology in general correlate with AI worry. Along the way, we’ll use the two waves of survey to look for changes over time.
7.1 Analysis, Visualization and Interpretation
First of all, let’s find out if my data agrees with the Pew Research Center results and shows an American population worried about artificial intelligence.
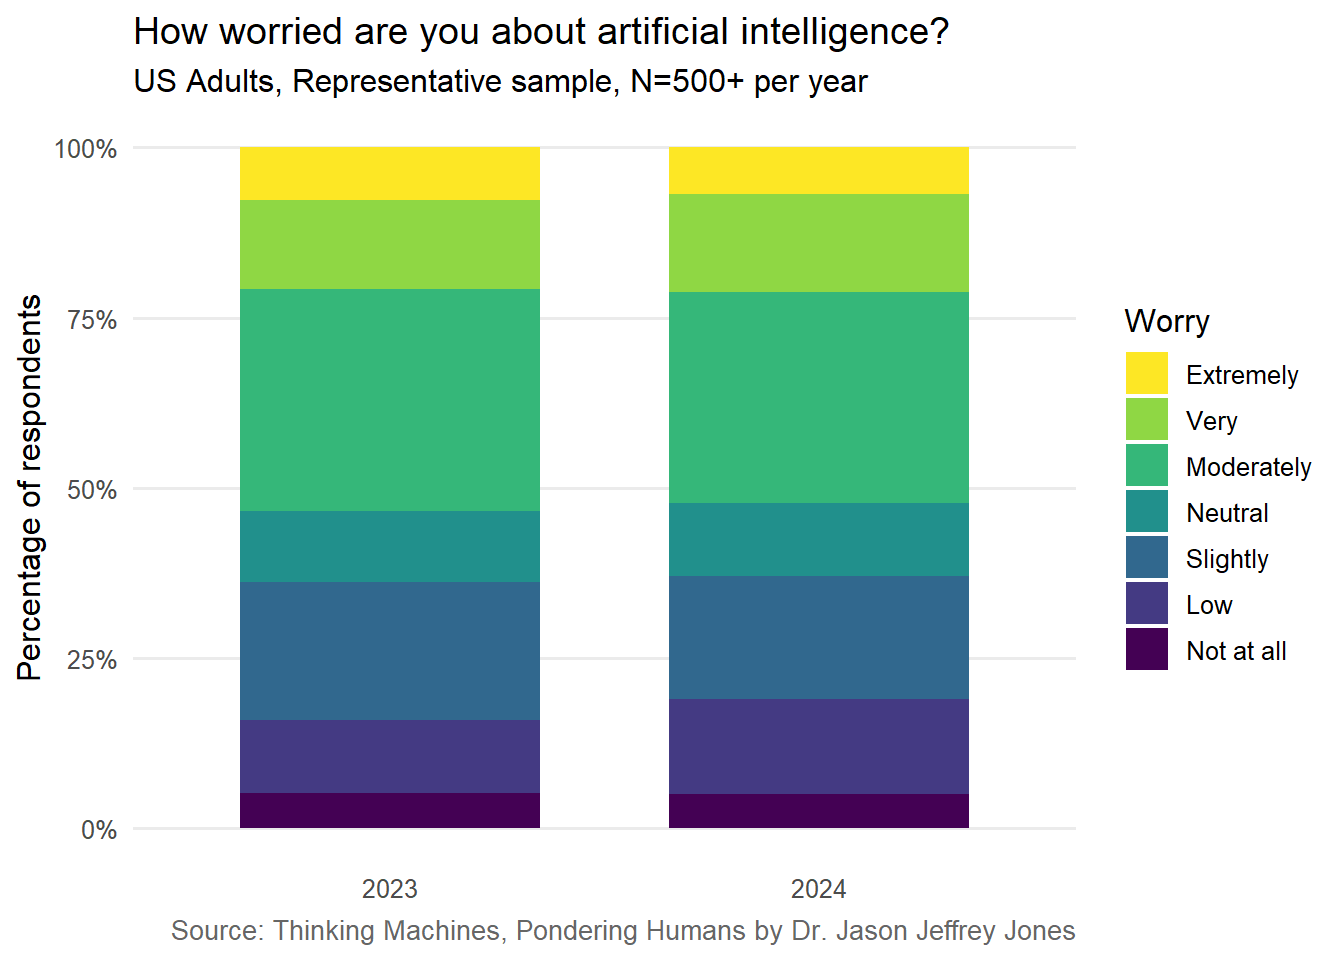
I asked directly: How worried are you about artificial intelligence? Let’s explore the results and how they changed from 2023 to 2024.
Code
# The file ai-indices-results-2023-wide-correlates.csv contains responses from a US representative sample of 509 respondents.# The file ai-indices-results-2024-wide-correlates.csv contains responses from a US representative sample of 500 respondents.# Download the files from OSF https://osf.io/umqtz/ or Zenodo https://zenodo.org/records/21630820responses2023 =read_csv("data/ai-indices-results-2023-wide-correlates.csv")responses2024 =read_csv("data/ai-indices-results-2024-wide-correlates.csv")responses =bind_rows(responses2023, responses2024)book_source_caption =paste0("Source: Thinking Machines, Pondering Humans by Dr. Jason Jeffrey Jones")# Plotworry_levels <-c("Not at all"=0,"Low"=1,"Slightly"=2,"Neutral"=3,"Moderately"=4,"Very"=5,"Extremely"=6)responses %>%mutate(Year =factor(Year),worry_ai =factor( worry_ai,levels =unname(worry_levels),labels =names(worry_levels),ordered =TRUE ) ) %>%count(Year, worry_ai) %>%group_by(Year) %>%mutate(proportion = n /sum(n) ) %>%ggplot(aes(x = Year,y = proportion,fill = worry_ai ) ) +geom_col(width =0.7,position =position_stack(reverse =TRUE) ) +scale_y_continuous(labels = scales::label_percent() ) +guides(fill =guide_legend(reverse =TRUE) ) +labs(title ="How worried are you about artificial intelligence?",subtitle ="US Adults, Representative sample, N=500+ per year",x =NULL,y ="Percentage of respondents",fill ="Worry",caption = book_source_caption ) +theme_minimal(base_size =12) +theme(panel.grid.major.x =element_blank(),panel.grid.minor =element_blank(),plot.caption =element_text(size =10,color ="#666666" ) )
Figure 7.1: How worried were American adults about artificial intelligence? How much did it change in one year from 2023 to 2024?
Most respondents felt some level of worry about AI. Only 5% said they were not at all worried. Note where the line for 50% crosses. In both 2023 and 2024, the median American was moderately worried about AI.
Code
# Estimate the change in mean worry from 2023 to 2024.worry_change_test <-t.test(x = responses$worry_ai[responses$Year ==2024],y = responses$worry_ai[responses$Year ==2023],alternative ="two.sided",conf.level =0.95)# Store values for inline reporting.worry_observed_difference <-unname( worry_change_test$estimate[1] - worry_change_test$estimate[2])worry_ci_lower <- worry_change_test$conf.int[1]worry_ci_upper <- worry_change_test$conf.int[2]worry_change_p <- worry_change_test$p.value
In the (eventful) year between the two surveys, the distribution of worry levels hardly changed. The estimated change in mean worry from 2023 to 2024 was -0.06 points on a seven-point scale. The 95% confidence interval for the change was -0.26 to 0.14, not reliably distinguishable from zero.
7.1.1 Worries about Applications of Artificial Intelligence
Self-driving cars and facial recognition are two applications of artificial intelligence Americans might have encountered in these years. Let’s investigate whether these more specific, more salient applications were more worrisome or less.
The aim is to contrast two arguments:
It is hard to worry about an abstraction; AI doesn’t bother people, but self-driving cars do.
Artificial Intelligence was more worrisome as a concept; applications already in use in the real-world were less.
Code
worry_levels <-c("Not at all"=0,"Low"=1,"Slightly"=2,"Neutral"=3,"Moderately"=4,"Very"=5,"Extremely"=6)# Convert the three worry measures from wide to long format.worry_application_data <- responses %>%mutate(respondent_id =row_number(),Year =factor(Year) ) %>%pivot_longer(cols =c( worry_ai, worry_self_driving, worry_facial ),names_to ="Topic",values_to ="Worry" ) %>%mutate(Topic =recode( Topic,worry_ai ="Artificial intelligence",worry_self_driving ="Self-driving cars",worry_facial ="Facial recognition algorithms" ),Topic =factor( Topic,levels =c("Artificial intelligence","Self-driving cars","Facial recognition algorithms" ) ) ) %>%filter(!is.na(Worry))# Calculate the response distribution within each year and topic.worry_application_plot_data <- worry_application_data %>%mutate(Worry =factor( Worry,levels =unname(worry_levels),labels =names(worry_levels),ordered =TRUE ) ) %>%count(Year, Topic, Worry) %>%group_by(Year, Topic) %>%mutate(proportion = n /sum(n) ) %>%ungroup()# Plot.ggplot( worry_application_plot_data,aes(x = Topic,y = proportion,fill = Worry )) +geom_col(width =0.72,position =position_stack(reverse =TRUE) ) +facet_wrap(~ Year,nrow =1 ) +scale_x_discrete(labels =c("Artificial intelligence"="Artificial\nintelligence","Self-driving cars"="Self-driving\ncars","Facial recognition algorithms"="Facial rec.\nalgos" ) ) +scale_y_continuous(labels = scales::label_percent(accuracy =1),expand =expansion(mult =c(0, 0.01)) ) +scale_fill_brewer(palette ="OrRd",direction =1,drop =FALSE ) +guides(fill =guide_legend(reverse =TRUE) ) +labs(title ="What worried Americans more: AI or its applications?",subtitle ="US Adults, Representative sample, N=500+ per year",x =NULL,y ="Percentage of respondents",fill ="Worry",caption = book_source_caption ) +theme_minimal(base_size =12) +theme(panel.grid.major.x =element_blank(),panel.grid.minor =element_blank(),strip.text =element_text(face ="bold"),plot.caption =element_text(size =10,color ="#666666" ) )
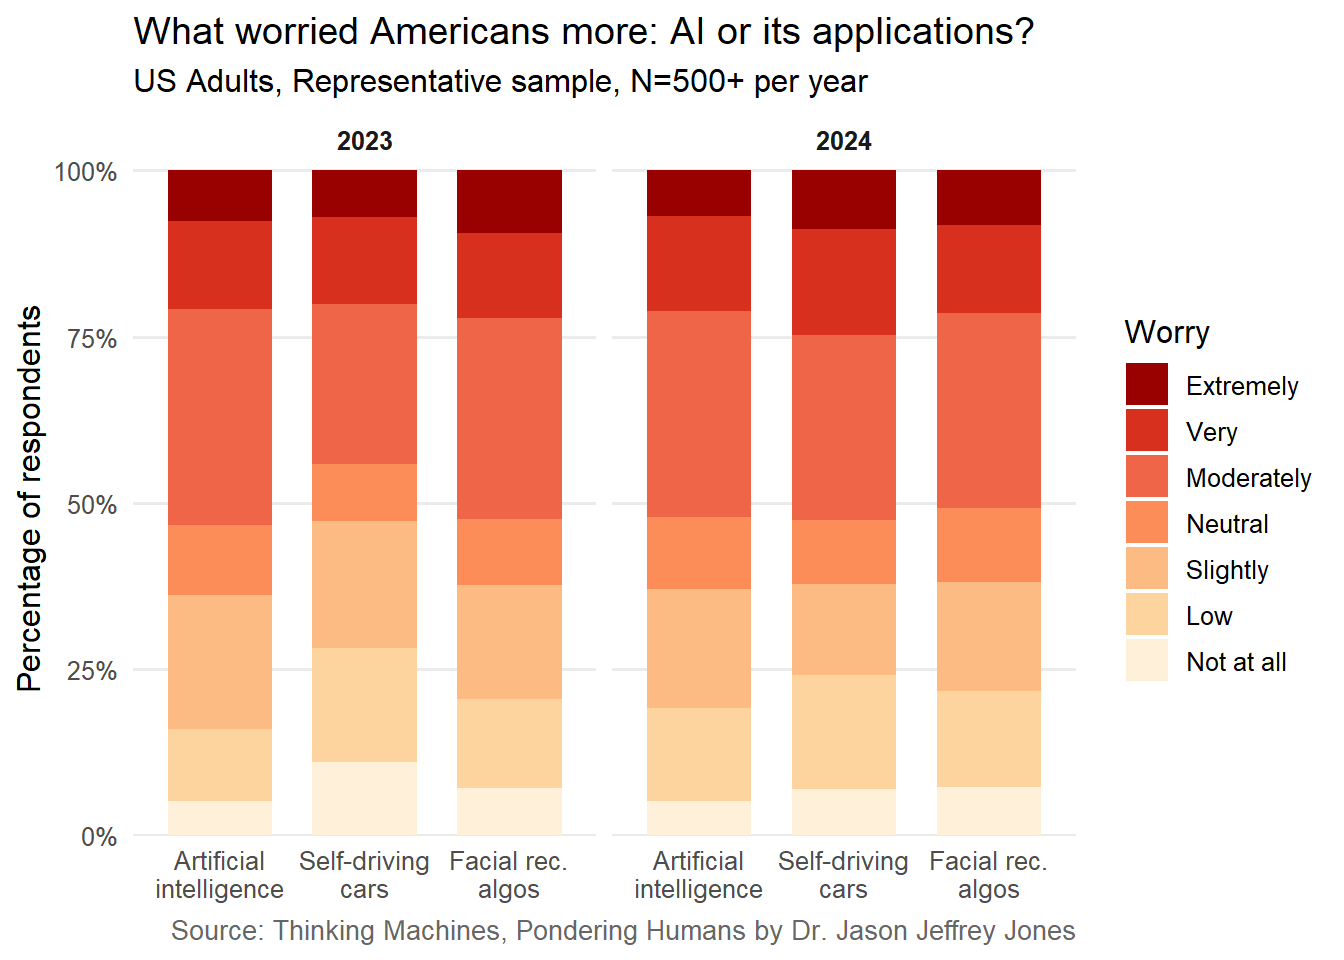
Figure 7.2: How worried were American adults about artificial intelligence, self-driving cars, and facial recognition algorithms? How much did those concerns change from 2023 to 2024?
You clearly see these bands look almost the same. Broadly, worry levels were similar across all the three items: artificial intelligence, self-driving cars, and facial recognition algorithms. With the current data, we need not concern ourselves much with the distinction AI as general concept versus specific AI applications.
One minor point: Worry level was statistically significantly lower — but only slightly — for self-driving cars in 2023. Just after this September 2023 survey, a human-driven car struck a pedestrian and knocked them into the path of a General Motors-owned Cruise autonomous vehicle, which then inadvertently dragged the person. The Cruise accident occurred in October 2023, and subsequently the company was fined for failing to provide information about the crash.
That breach of trust arguably eliminated self-driving cars’ lower-worry status, making them about as worrisome to Americans as AI in general.
7.1.2 Comparing to Other Technology Worries
It would be very useful to compare worries about AI to worries about other technologies. It’s a good thing another part of the survey was designed for exactly that purpose. Respondents were shown many technologies and told to Click on all those that make you worried about the future.
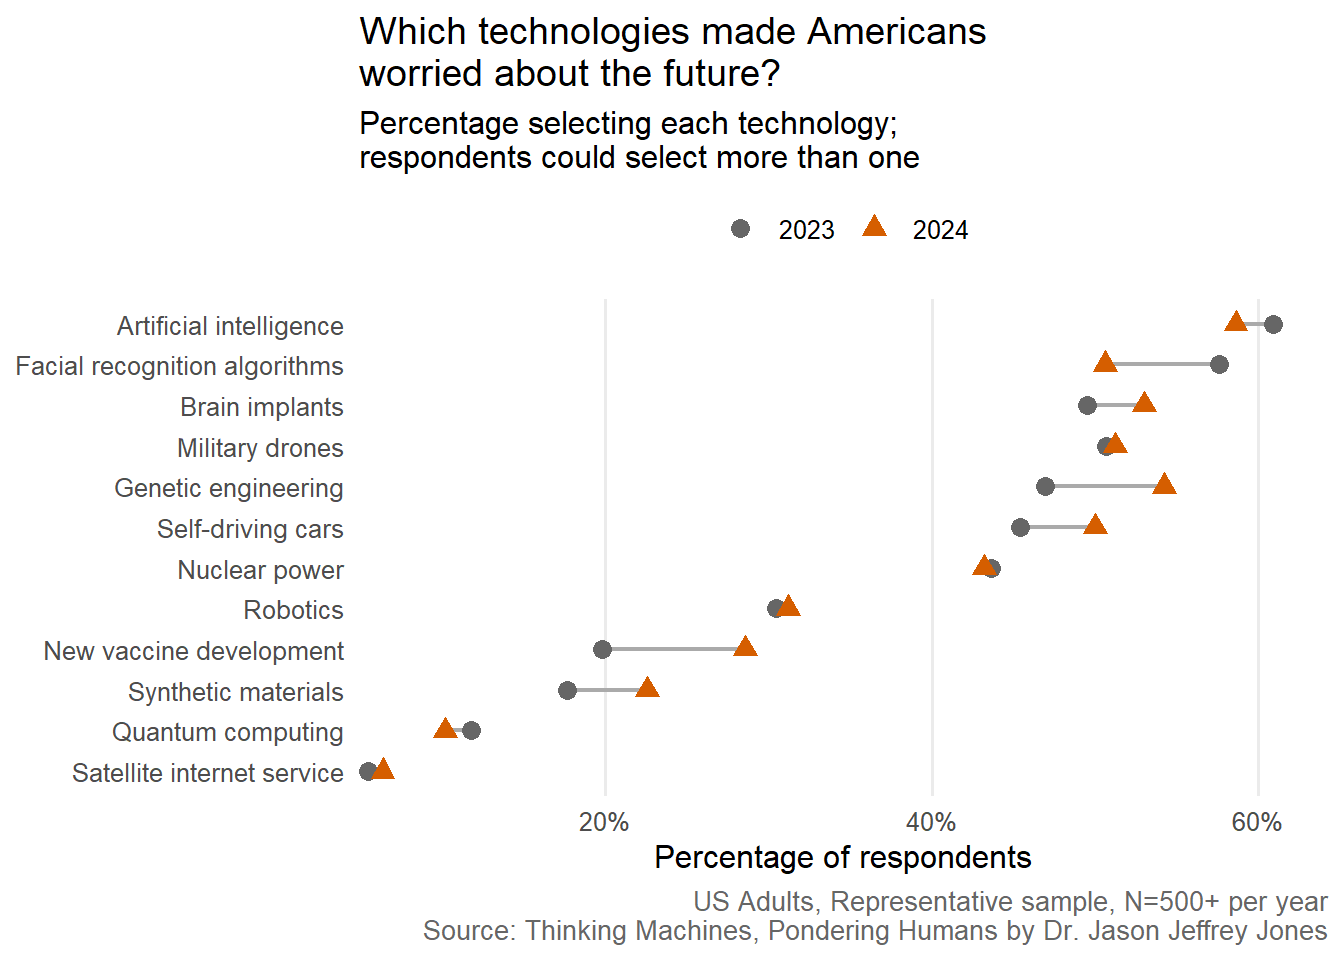
Let’s see how popular it was to worry about each technology over both waves of the survey.
Code
# Convert the binary worried_ items from wide to long format.technology_worry_data = responses %>%mutate(respondent_id =row_number(),Year =factor( Year,levels =c(2023, 2024) ) ) %>%select( respondent_id, Year,starts_with("worried_") ) %>%pivot_longer(cols =starts_with("worried_"),names_to ="Technology",values_to ="Worried" ) %>%mutate(Technology =recode( Technology,worried_artificial_intelligence ="Artificial intelligence",worried_brain_implants ="Brain implants",worried_facial_recognition_algorithms ="Facial recognition algorithms",worried_genetic_engineering ="Genetic engineering",worried_military_drones ="Military drones",worried_new_vaccine_development ="New vaccine development",worried_nuclear_power ="Nuclear power",worried_quantum_computing ="Quantum computing",worried_robotics ="Robotics",worried_satellite_internet_service ="Satellite internet service",worried_self_driving_cars ="Self-driving cars",worried_synthetic_materials ="Synthetic materials" ) ) %>%filter(!is.na(Worried))# Calculate the percentage selecting each technology within each year.technology_worry_summary = technology_worry_data %>%group_by(Year, Technology) %>%summarize(N =n(),proportion_worried =mean(Worried),.groups ="drop" )# Order technologies by their selection rate across both years.technology_order = technology_worry_data %>%group_by(Technology) %>%summarize(overall_proportion =mean(Worried),.groups ="drop" ) %>%arrange(overall_proportion) %>%pull(Technology)technology_worry_summary = technology_worry_summary %>%mutate(Technology =factor( Technology,levels = technology_order ) )# Plot.ggplot( technology_worry_summary,aes(x = proportion_worried,y = Technology,group = Technology )) +geom_line(color ="#AAAAAA",linewidth =0.8 ) +geom_point(aes(color = Year,shape = Year ),size =3 ) +scale_x_continuous(labels = scales::label_percent(accuracy =1),expand =expansion(mult =c(0.01, 0.06)) ) +scale_color_manual(values =c("2023"="#666666","2024"="#D55E00" ) ) +labs(title ="Which technologies made Americans\nworried about the future?",subtitle ="Percentage selecting each technology;\nrespondents could select more than one",x ="Percentage of respondents",y =NULL,color =NULL,shape =NULL,caption =paste0("US Adults, Representative sample, N=500+ per year\n", book_source_caption) ) +theme_minimal(base_size =12) +theme(panel.grid.major.y =element_blank(),panel.grid.minor =element_blank(),legend.position ="top",plot.caption =element_text(size =10,color ="#666666" ) )
Figure 7.3: Which technologies made Americans worried about the future? Was AI exceptional? How did that change from 2023 to 2024?
Artificial intelligence was the most frequently selected technology (among these options) in both 2023 and 2024. More respondents indicated that AI made them worried about the future than nuclear power and genetic engineering.
Note that this analysis comports with the Worries about Applications of Artificial Intelligence section above. The proportion of worried respondents for self-driving cars increased to become about even with facial recognition algorithms in 2024.
7.1.3 Were Worriers Well-Informed?
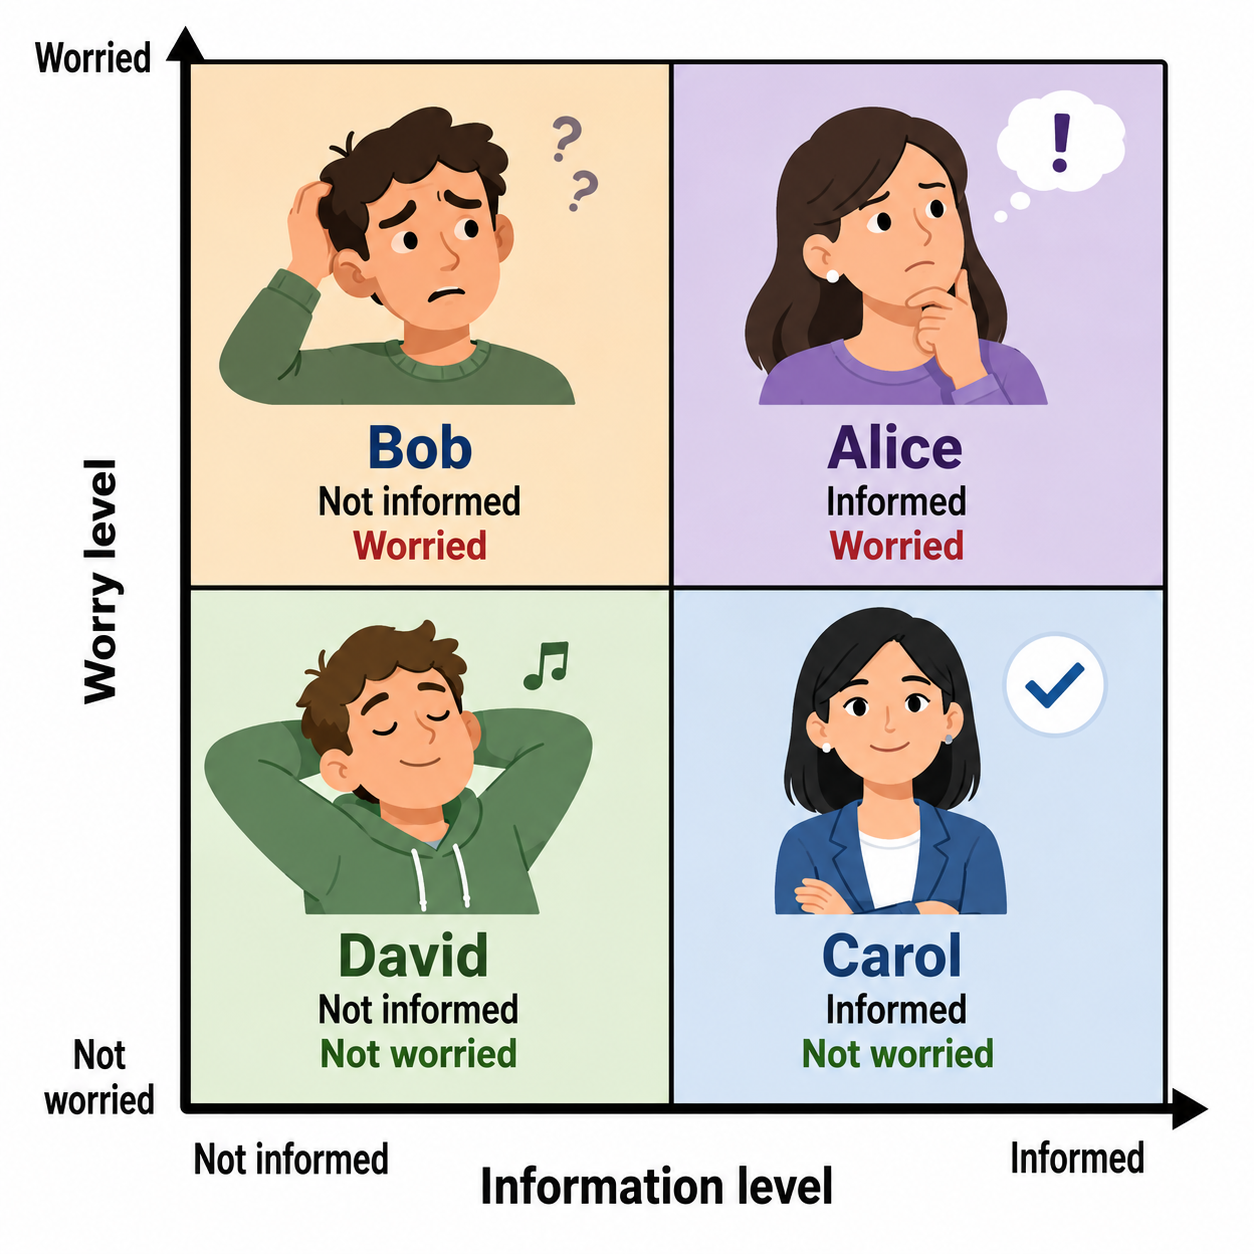
Imagine two different kinds of worriers. Alice is informed about a technology (say AI), and what she knows about its capabilities and risks makes her worried about the future. Bob is also worried about AI, but is not informed; his anxiety comes from skimmed headlines and vague recall of some movies.
In this scenario, there are two axes: Informed and Worried. So Alice and Bob represent only two of the four possibilities — Informed and Not Informed Worriers — while there are two types of Nonworriers as well. Carol is informed like Alice, but she doesn’t worry. Perhaps her experiences with the technology have been positive or benign. David is neither informed nor worried; his attention is elsewhere.
Figure 7.4: Avatars illustrate the Informed-Worried space.
Indirectly, the survey asked respondents to place themselves into one of the quadrants for twelve technologies. They were asked which technologies made them worried about the future, and separately, which technologies they considered themselves informed about.
Let’s use the data to answer two questions.
In general, did Americans consider themselves informed about technologies that made them worried about the future?
Did Americans place AI in an exceptional position on the axes, or did AI fit into a general pattern?
Code
# Match each worried_ item with its corresponding informed_ item.technology_space_data = responses %>%mutate(respondent_id =row_number(),Year =factor( Year,levels =c(2023, 2024) ) ) %>%select( respondent_id, Year,matches("^(worried|informed)_") ) %>%pivot_longer(cols =matches("^(worried|informed)_"),names_to =c(".value", "Technology"),names_pattern ="^(worried|informed)_(.*)$" ) %>%mutate(Technology =recode( Technology,artificial_intelligence ="Artificial intelligence",brain_implants ="Brain implants",facial_recognition_algorithms ="Facial recognition algorithms",genetic_engineering ="Genetic engineering",military_drones ="Military drones",new_vaccine_development ="New vaccine development",nuclear_power ="Nuclear power",quantum_computing ="Quantum computing",robotics ="Robotics",satellite_internet_service ="Satellite internet service",self_driving_cars ="Self-driving cars",synthetic_materials ="Synthetic materials" ) )# Calculate the percentage informed and worried about each technology.technology_space_summary = technology_space_data %>%group_by(Year, Technology) %>%summarize(proportion_informed =mean(informed, na.rm =TRUE),proportion_worried =mean(worried, na.rm =TRUE),.groups ="drop" ) %>%mutate(AI = Technology =="Artificial intelligence" )# Use the same cropped range for both axes and both panels.plot_range =range(c( technology_space_summary$proportion_informed, technology_space_summary$proportion_worried ),na.rm =TRUE)plot_limits =c(max(0,floor((plot_range[1] -0.03) *20) /20 ),min(1,ceiling((plot_range[2] +0.03) *20) /20 ))# Plot.ggplot( technology_space_summary,aes(x = proportion_informed,y = proportion_worried )) +geom_abline(slope =1,intercept =0,linetype ="dashed",color ="#999999",linewidth =0.7 ) +geom_point(aes(color = AI,shape = AI ),size =3 ) +geom_text_repel(aes(label = Technology,color = AI ),size =3,seed =123,box.padding =0.35,point.padding =0.25,min.segment.length =0,max.overlaps =Inf,show.legend =FALSE ) +facet_wrap(~ Year,nrow =1 ) +scale_x_continuous(labels = scales::label_percent(accuracy =1),breaks = scales::breaks_width(0.10) ) +scale_y_continuous(labels = scales::label_percent(accuracy =1),breaks = scales::breaks_width(0.10) ) +scale_color_manual(values =c("FALSE"="#666666","TRUE"="#D55E00" ),guide ="none" ) +scale_shape_manual(values =c("FALSE"=16,"TRUE"=18 ),guide ="none" ) +coord_equal(xlim = plot_limits,ylim = plot_limits,clip ="off" ) +labs(title ="Were Americans informed about technologies that worried them?",subtitle ="Each point represents one technology; the dashed line\nmarks equal percentages informed and worried",x ="Considered themselves informed",y ="Worried about the future",caption =paste0("US Adults, Representative sample, N=500+ per year\n", book_source_caption) ) +theme_minimal(base_size =12) +theme(panel.grid.minor =element_blank(),strip.text =element_text(face ="bold" ),plot.caption =element_text(size =10,color ="#666666" ),plot.margin =margin(5.5,35,5.5,5.5 ) )
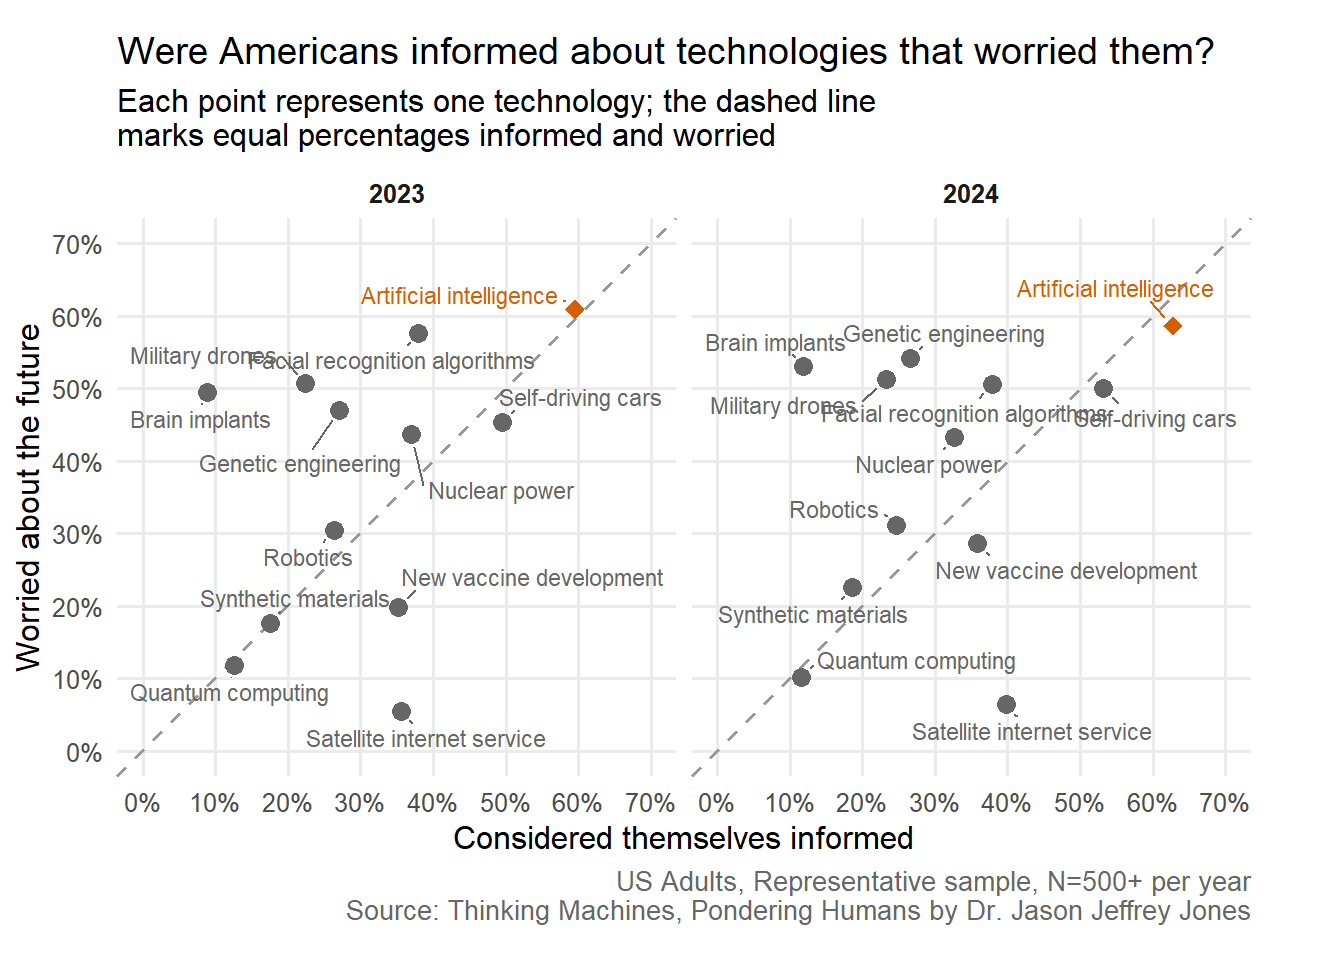
Figure 7.5: Where did technologies fall in the Informed-Worried spaces of 2023 and 2024?
In one figure, we’ve addressed both questions above. Clearly, one sees that the Informed-to-Worried relationship is not a simple y=x line. Americans, on average, do not consider themselves well-informed about Satellite internet service, but that technology causes them almost no worry about the future. On the other hand, Brain implants were worrying to many while very few consider themselves informed. Overall, these technologies were scattered about the space.
Artificial intelligence occupied the upper-right in both years. AI was the technology the largest percentage of respondents reported being well-informed about. At the same time, in both years, AI was the most worrying.
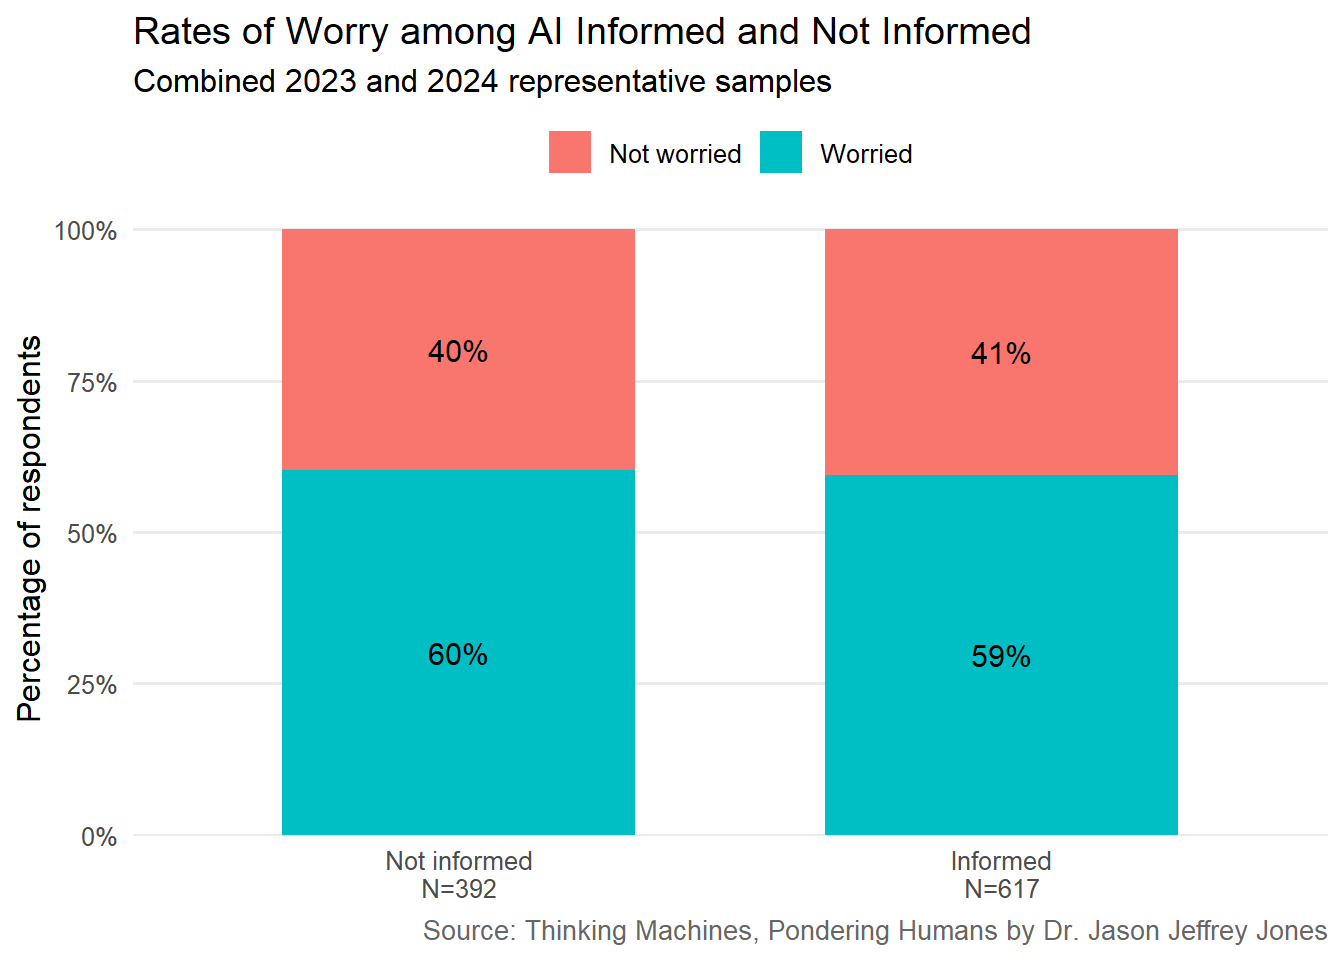
There is one more subtle point to cover. Figure 7.5 does not tell us who was worried. More precisely, we want to contrast the rate of Worriers among the AI-Informed and Not Informed.
Figure 7.6: Were AI-Informed respondents less worried?
All four quadrants were well-populated. Curiously, Worry levels did not differ between respondents who reported being well-informed and those who reported being not well-informed.
7.1.4 Dispositions toward Technology
Let’s broaden our perspective again, and consider respondents’ dispositions toward technology. On a seven-point scale, two survey items inquired how much Americans agreed that:
All in all, most technology provides more benefits than drawbacks.
Developing new technologies creates more danger to society.
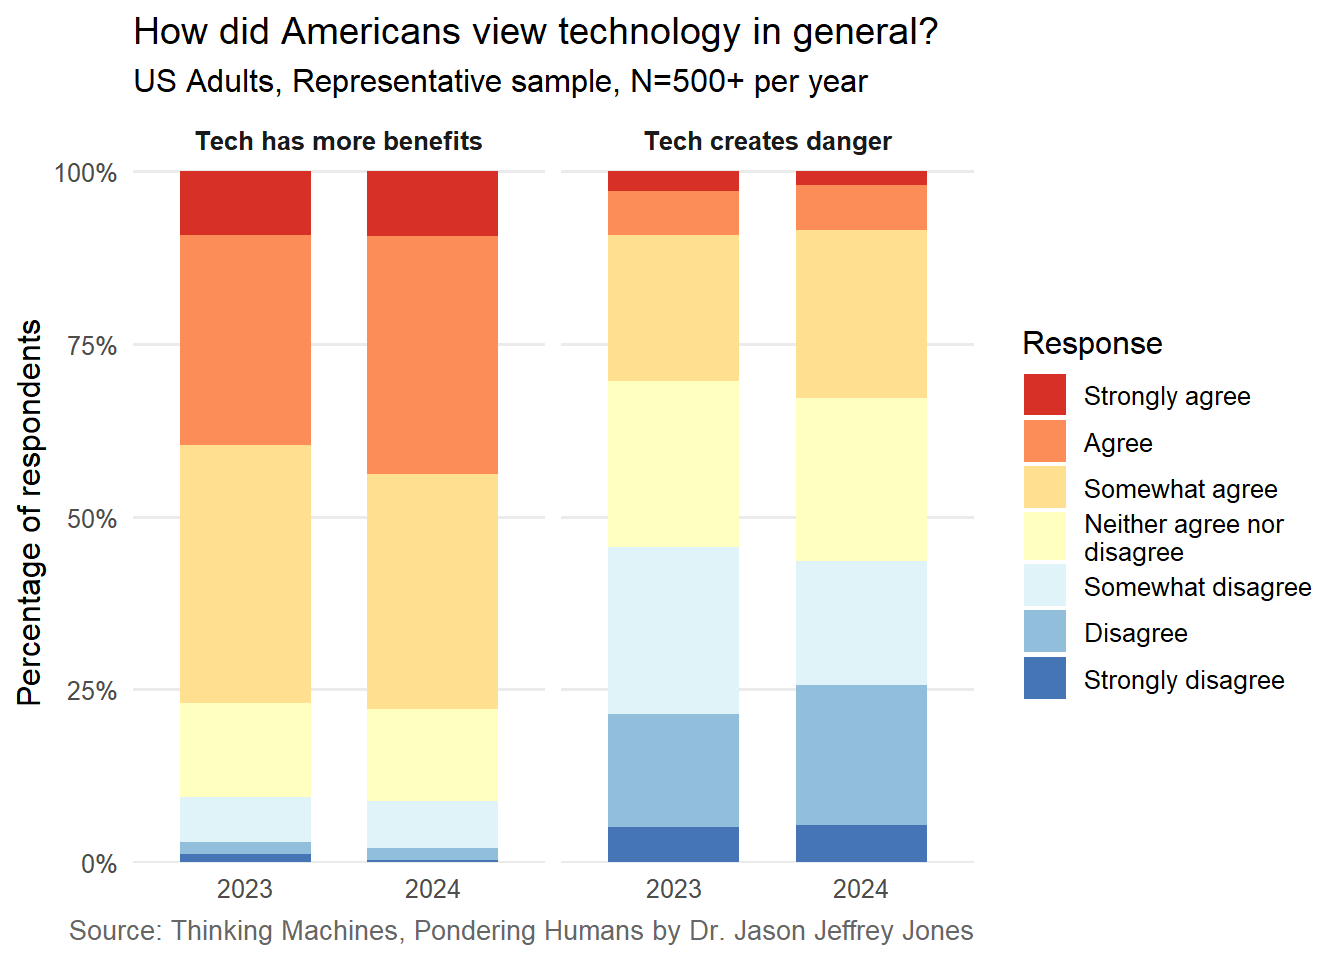
The next figure plots response distributions over time.
Figure 7.7: Did American adults consider technology in general to be beneficial? Dangerous? Did that change from 2023 to 2024?
Code
# Test for item agreement change across years.disposition_test_results <-tibble(Item =c("Technology has more benefits","New technology is dangerous" ),Variable =c("tech_more_benefits","new_tech_danger" )) %>%rowwise() %>%mutate(Mean_2023 =mean( responses[[Variable]][responses$Year ==2023],na.rm =TRUE ),Mean_2024 =mean( responses[[Variable]][responses$Year ==2024],na.rm =TRUE ),Mean_change = Mean_2024 - Mean_2023,Welch_p =t.test( responses[[Variable]] ~ responses$Year )$p.value,Wilcoxon_p =wilcox.test( responses[[Variable]] ~ responses$Year,exact =FALSE )$p.value ) %>%ungroup() %>%mutate(Welch_p_Holm =p.adjust(Welch_p, method ="holm"),Wilcoxon_p_Holm =p.adjust(Wilcoxon_p, method ="holm") )disposition_test_results# Test agreement difference between two tech disposition items.responses %>%filter(!is.na(tech_more_benefits),!is.na(new_tech_danger) ) %>%group_by(Year) %>%group_modify(~ { test <-t.test( .x$tech_more_benefits, .x$new_tech_danger,paired =TRUE )tibble(mean_difference =unname(test$estimate),confidence_low = test$conf.int[1],confidence_high = test$conf.int[2],p_value = test$p.value ) } )
On average, American adults were more techno-optimistic than not. They disagreed that new technologies create danger, and did agree that technology has more benefits than drawbacks.
There is not evidence that average response to either item changed from one year to the next. This leads me to an aside I will take now. I can imagine someone asking: Why document lack of change? There are many reasons. Here I present two.
First, I hope to inoculate against future hyperbolic claims. I imagine future essays claiming the dawn of generative AI as the moment Americans stopped believing in progress or conversely, the moment they began to expect technological solutions to every problem. It is good to have the baseline results from these 2023 and 2024 surveys. This baseline says: Americans were mildly positive in their expectations for technology, and that was a stable result.
Second, it is good to have a source of evidence beyond personal anecdote, and I believe that large, representative-sample, repeated surveys are one of the best sources of evidence. In much discussion I have observed (online and off) any assertion is immediately met by claims from small, highly-selected, non-representative samples — namely the interlocutor and their circle of friends. I place evidence like this chapter in places I hope it to be found, with the dream that someday someone cares.
For our next topic, let’s connect the benefits and danger items to an earlier discussion. You would be right to wonder how strong is the connecteion between Americans’ worries about AI and their tech dispositions. Let’s explore that with a correlation matrix.
Code
# Select, reverse-code, and label the five items.worryDispositionItems <- responses %>%transmute(`Worry About AI`=as.numeric(worry_ai),`Worry About Self-Driving Cars`=as.numeric(worry_self_driving),`Worry About Facial Recognition`=as.numeric(worry_facial),`Technology Has More Benefits`=as.numeric(tech_more_benefits),`Technology Is Not Dangerous`=-as.numeric(new_tech_danger) )# Correlation matrix.worryDispositionCor <-cor( worryDispositionItems,use ="pairwise.complete.obs")# Reorder items so similar correlation profiles appear near each other.# This is not a substantive cluster model; it is only for figure readability.worryDispositionCluster <-hclust(as.dist(1- worryDispositionCor),method ="average")worryDispositionOrder <- worryDispositionCluster$labels[ worryDispositionCluster$order]# Convert to long format for ggplot.worryDispositionCorLong <- worryDispositionCor %>%as.data.frame() %>%rownames_to_column("Item_1") %>%pivot_longer(cols =-Item_1,names_to ="Item_2",values_to ="Correlation" ) %>%mutate(Item_1 =factor( Item_1,levels = worryDispositionOrder ),Item_2 =factor( Item_2,levels =rev(worryDispositionOrder) ) )# Plot.ggplot( worryDispositionCorLong,aes(x = Item_1,y = Item_2,fill = Correlation )) +geom_tile(color ="white",linewidth =0.5 ) +geom_text(aes(label =round(Correlation, 2) ),size =3.5 ) +scale_fill_gradient2(low ="firebrick",mid ="white",high ="steelblue",midpoint =0,limits =c(-1, 1),breaks =seq(-1, 1, by =0.5) ) +scale_x_discrete(labels = \(x) stringr::str_wrap(x, width =15) ) +scale_y_discrete(labels = \(x) stringr::str_wrap(x, width =15) ) +coord_equal() +labs(title ="How Are AI Worries and Technology Dispositions Related?",subtitle ="Items are ordered by similarity in their correlation profiles.",x =NULL,y =NULL,fill ="Correlation" ) +theme_minimal() +theme(axis.text.x =element_text(angle =45,hjust =1 ),panel.grid =element_blank(),legend.position ="right" )
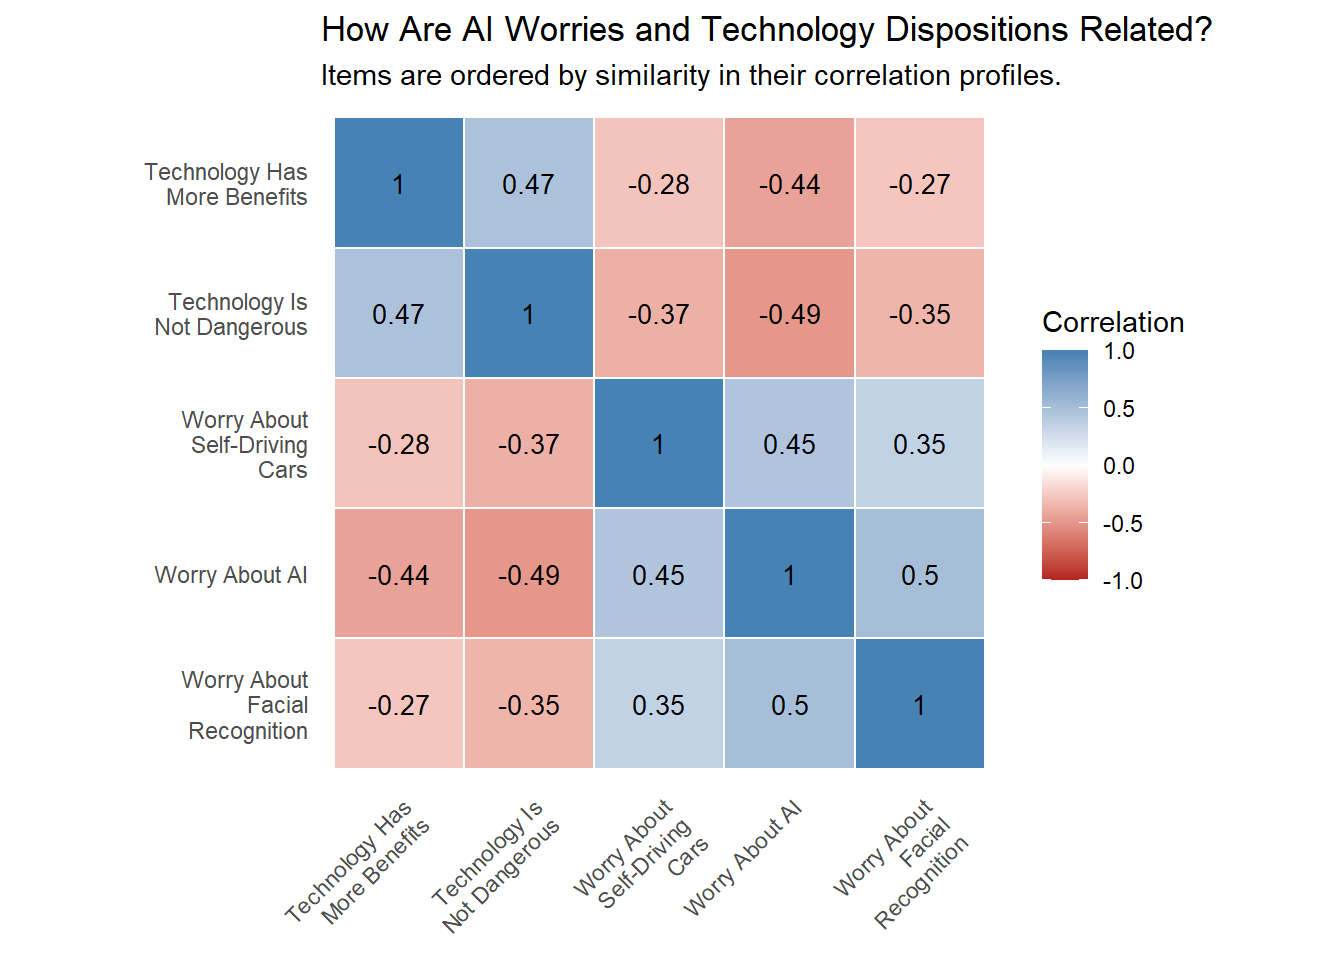
Figure 7.8: Correlations among worry about artificial intelligence and its applications, perceived technological benefits, and the reverse-coded belief that developing new technologies creates danger.
It is nice to see clear structure in the matrix. Those who were optimistic toward technology were less worried about AI and its applications.
Interestingly, the strongest cross-block relationships involved worry about AI. (Inspect the fourth row.) AI worry correlated with more benefits at r = −.44, and with not dangerous at r = −.49.
The corresponding relationships were weaker for facial recognition and self-driving cars. (Inspect the third and fifth rows.) It is possible that general dispositions toward technology mattered most when people evaluated AI as an abstract category. When they evaluated concrete applications, their judgments were less tied to their general disposition and may also have depended on application-specific concerns or experience.
7.2 Survey Items, Respondents and Costs
7.2.1 Survey Items
The intent of these surveys was to measure Americans’ worries about AI specifically and compare it to their worries about technology generally.
Two items addressed technology. Respondents were asked how much they agreed with:
All in all, most technology provides more benefits than drawbacks.
Developing new technologies creates more danger to society.
Three items addressed AI specifically. On a seven-point scale, respondents were asked:
How worried are you about artificial intelligence?
How worried are you about self-driving cars?
How worried are you about facial recognition algorithms?
Another item allowed comparison across named technologies. The respondents were told: Below is a list of technologies. Click on all those that make you worried about the future. The options were:
Artificial intelligence
Brain implants
Facial recognition algorithms
Genetic engineering
Military drones
New vaccine development
Nuclear power
Quantum computing
Robotics
Satellite internet service
Self-driving cars
Synthetic materials
Separately, the same list of technologies was presented with the prompt: Click all of the following technologies you consider yourself informed about. This allowed analysis of the relationship between considering oneself informed about a technology and being worried about it.
7.2.2 Respondents
Respondents were recruited through Prolific Academic. I requested a representative sample of 500 American adults. Specifically, I chose the option “USA, Factors: Sex, Age, Ethnicity (Simplified US Census).”
The study was run once August 15-17, 2023 and again September 13-14, 2024.
To demonstrate the demographic coverage, below I provide the Sex and Age crosstab:
The survey took 3 minutes. Each respondent was paid $0.60. Thus, the total of payments to respondents was $305.40 = 509 * $0.60 for the 2023 wave plus $300 = 500 * $0.60 for the 2024 wave.
Prolific Academic charged a Service fee equal to 33.3% of respondent payments. This totaled $201.60.
During this time, Prolific waived the Representative sample fee.
Thus, the total cost for the two-wave survey was $807.
R code for analysis and visualization is embedded above (some formats) or available at TODO GITHUB/ZENODO.
TODO create and link GitHub repo that has all the raw files. Manually exclude _cache directories.
7.4 Summary and What’s Next
I gathered data for this chapter in 2023 and 2024, but did the analysis and writing in 2026. My biggest surprise was the stability across a year of rapid technological development. In this time, the OpenAI board attempted and failed to oust Sam Altman. Google Gemini’s image generation insisted on producing Native American Nazis. Scarlett Johansson objected to the similarity between her voice and OpenAI’s Sky speech model. Google launched Gemini 1.0, while OpenAI, Anthropic, Meta and xAI iterated on public consumer products.
And American adults’ attitudes stayed put! With the possible, intriguing exception of self-driving cars, 2023 and 2024 appear equivalent. Americans were more worried about AI than other technologies, but only moderately worried with no large increase. Strong negative attitudes toward technological development were absent. I note this again, because I think many hyperbolic claims will be made in the future based on small slices of online discourse.
I found American adults populating all four corners of the Informed-Worried axes. Worry about AI did not stem from ignorance; instead the self-appointed Informed and Uninformed worried at near-equal rates.
Attitudes did not vary wildly over time. Those with sanguine beliefs about technology in general worried less about AI specifically. Attitudes toward AI and its applications were not far apart. The full story of this Chapter is one of consistency.