More than anything, Americans fear who will control AI. They fear that Artificial Intelligence will be controlled by people who are greedy, selfish or irresponsible - much more than they fear losing their own job or AI leading to human extinction.
Now that I have repeated the survey, let’s see where Americans’ AI fears are directed.
4.1 Analysis, Visualization and Interpretation
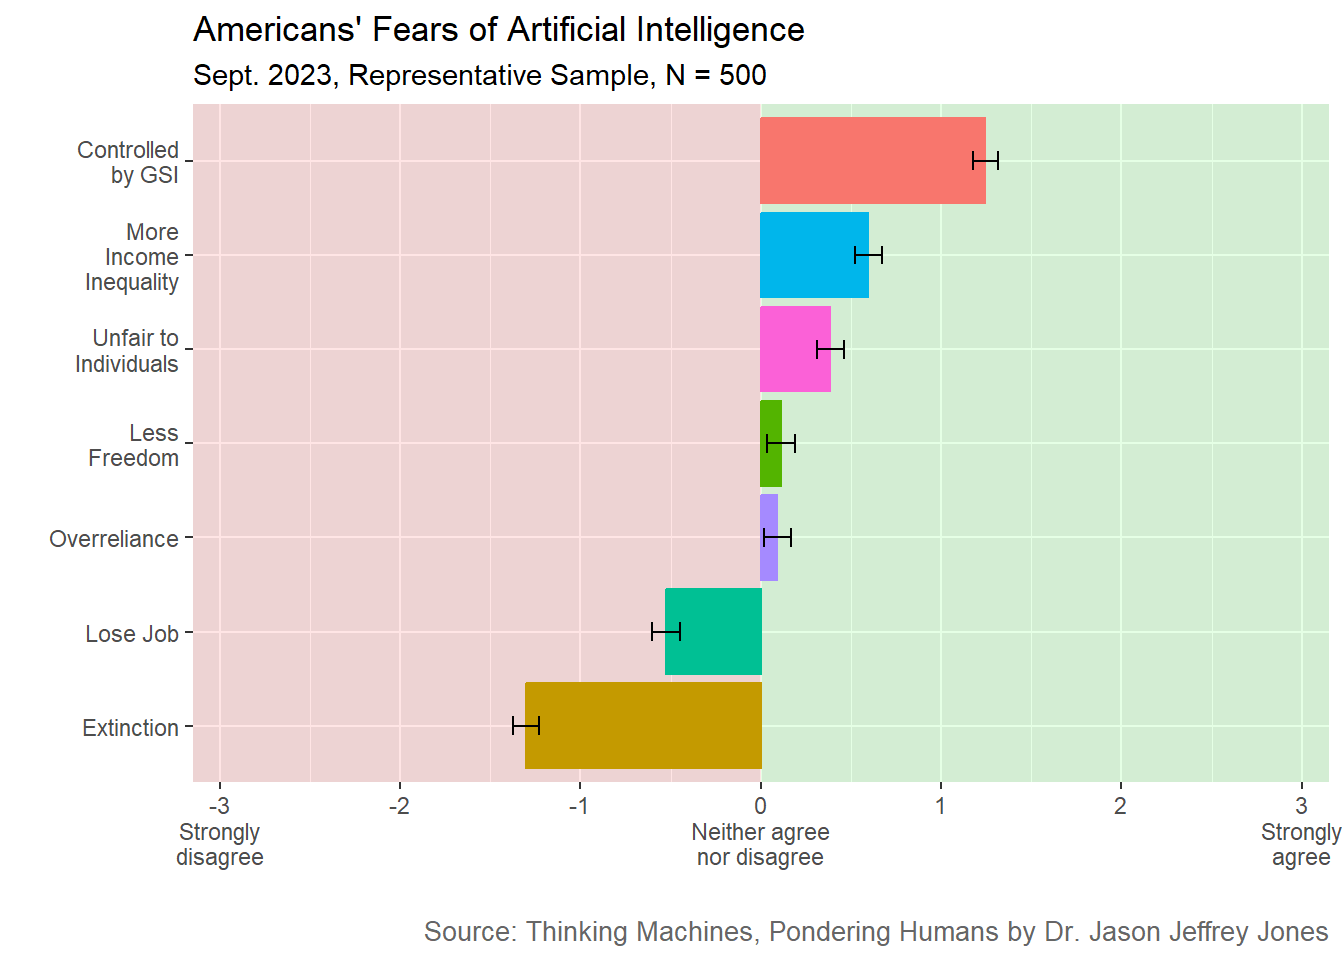
I presented seven potential negative outcomes of artificial intelligence to survey respondents. In this Chapter, I will refer to these potential negative outcomes as Fear Scenarios (i.e. scenarios to be feared). Let’s first consider the 2023 survey of 500 US respondents from a representative sample. How much did they fear each scenario?
Code
library(tidyverse)library(scales)# The file ai-fear-scenarios-2023-wide-correlates.csv contains responses from a US representative sample of 500 respondents.# Download the file from a public Open Science Framework repository at https://osf.io/download/qpdvb/responses =read_csv("data/ai-fear-scenarios-2023-wide-correlates.csv")# Select columns and pivot.fearResponses = responses %>%select(Extinction:Controlled_by_GSI) %>%pivot_longer(cols =everything(),names_to ="Fear",names_transform =list(Fear =~gsub("_", " ", .)),values_to ="Response")# Set up some options for the figure.fear_scenarios_summary_2023_caption =paste0("Source: Thinking Machines, Pondering Humans by Dr. Jason Jeffrey Jones")# Summary Fear 2023 figurefearResponses %>%group_by(Fear) %>%summarise(Mean_Response =mean(Response),sd =sd(Response),n =n(),se = sd /sqrt(n),error_low = Mean_Response - se,error_high = Mean_Response + se ) %>%ggplot(aes(x =reorder(Fear, Mean_Response), y = Mean_Response, color = Fear, fill = Fear)) +# Add green and red shading to demarcate agree vs disagree.annotate(geom="rect", xmin=-Inf, xmax=Inf, ymin=0.0, ymax=Inf, fill="green", alpha=0.1) +annotate(geom="rect", xmin=-Inf, xmax=Inf, ymin=-Inf, ymax=0.0, fill="red", alpha=0.1) +# Annotations go first, so data elements are layered on top.geom_col() +geom_errorbar(aes(ymin = error_low, ymax = error_high), color="black", width=0.2) +ggtitle("Americans' Fears of Artificial Intelligence", "Sept. 2023, Representative Sample, N = 500") +xlab("") +ylab("") +# Apply labels with wrapping.scale_x_discrete(labels =label_wrap(10)) +# Set color and fill values.# Force y scale to -3 through 3. Put numbers on y-axis. Add low and high labels.scale_y_continuous(limits =c(-3,3), breaks =-3:3, labels =c("-3\nStrongly\ndisagree", "-2", "-1", "0\nNeither agree\nnor disagree", "1", "2", "3\nStrongly\nagree"), expand=expansion(mult =0.025)) +labs(caption = fear_scenarios_summary_2023_caption) +theme(plot.caption =element_text(size=10, color ="#666666")) +# The legend has only redundant information. Get rid of it.theme(legend.position ="none") +coord_flip()
Figure 4.1: AI Fear Scenario results. Plotted is mean response on a 7-point Likert scale from Strongly disagree to Strongly agree. Black bars are +/- one standard error.
On average, Americans were least fearful that AI would cause human extinction. Losing their own job was also not a strong fear.
Americans’ top fear was that AI would be controlled by people who are greedy, selfish or irresponsible.
4.1.1 Change Over Time
Let’s compare how Americans feared AI in 2021 and 2023. See Table Table 4.1.
Code
##| tbl-subcap: "Higher ranks indicate greater fear."library(knitr)# The file ai-fear-scenarios-results-2021.csv contains responses from a US representative sample of 100 respondents.# Download the file from a public Open Science Framework repository at https://osf.io/download/kujg8/responses2021 =read_csv("data/ai-fear-scenarios-results-2021.csv")# Prepare 2021 data.fearResponses2021 = responses2021 %>%select(Full_Prompt, Response) %>%# Keep the AI fear items.filter(grepl("How much do you agree with this statement:", Full_Prompt, fixed =TRUE)) %>%# Remove the AI knowledge item.filter(!grepl("For games like checkers and chess, ", Full_Prompt, fixed =TRUE)) %>%# Create short forms of each fear.mutate(Fear =case_when(grepl("I fear that Artificial Intelligence will lead to the extinction of human beings.", Full_Prompt, fixed =TRUE) ~"Extinction",grepl("I fear that Artificial Intelligence will lead to me losing my job involuntarily.", Full_Prompt, fixed =TRUE) ~"Lose Job",grepl("I fear that Artificial Intelligence will lead to individuals being treated unfairly.", Full_Prompt, fixed =TRUE) ~"Unfair to Individuals",grepl("I fear that Artificial Intelligence will lead to more income inequality.", Full_Prompt, fixed =TRUE) ~"More Income Inequality",grepl("I fear that Artificial Intelligence will lead to less freedom for individuals.", Full_Prompt, fixed =TRUE) ~"Less Freedom",grepl("I fear that as a society we will come to rely on Artificial Intelligence, and then it will fail catastrophically.", Full_Prompt, fixed =TRUE) ~"Overreliance",grepl("I fear that Artificial Intelligence will be controlled by people who are greedy, selfish or irresponsible.", Full_Prompt, fixed =TRUE) ~"Controlled by GSI",grepl("I fear that Artificial Intelligence will lead to more income inequality.", Full_Prompt, fixed =TRUE) ~"More Income Inequality",TRUE~"Other" ) ) %>%# Transform Response to match the -3 to +3 range.mutate(Response = Response -4)fearResponses2021 = fearResponses2021 %>%select(Fear, Response) %>%mutate(Year =2021)fearResponses2023 = fearResponses %>%select(Fear, Response) %>%mutate(Year =2023)compareFearResponses =bind_rows(fearResponses2021, fearResponses2023)compareFearResponses %>%group_by(Fear, Year) %>%summarise(Mean_Response =round(mean(Response), 2), .groups ="drop") %>%pivot_wider(names_from = Year, values_from = Mean_Response) %>%arrange(-`2023`) %>%mutate(Rank_2023 =row_number(-`2023`),Rank_2021 =row_number(-`2021`),Rank_Change = Rank_2023 - Rank_2021,Rank_Change_Label =case_when( Rank_Change >0~paste0("down ", Rank_Change), Rank_Change <0~paste0("up ", abs(Rank_Change)),TRUE~"unchanged" ), ) %>%mutate(Change =`2023`-`2021`) %>%select(Fear, Rank_Change_Label, Rank_2023, Rank_2021, Change, `2023`, `2021`) %>%mutate(Change =sprintf("%+0.2f", Change)) %>%rename(`Rank (2021)`= Rank_2021,`Rank (2023)`= Rank_2023,`Mean (2021)`=`2021`,`Mean (2023)`=`2023`,`Rank Change`= Rank_Change_Label ) %>%kable(align =c("l", "l", "r", "r", "r", "r", "r"))#::: {.callout-note}#My apologies - this chapter is not yet complete. Subscribe to my [once-weekly-or-less email #newsletter](https://jasonjeffreyjones.substack.com/) to be notified when it is complete.#:::
Table 4.1: Changes in AI fear rankings between 2021 and 2023.
Fear
Rank Change
Rank (2023)
Rank (2021)
Change
Mean (2023)
Mean (2021)
Controlled by GSI
unchanged
1
1
+0.29
1.25
0.96
More Income Inequality
up 1
2
3
+0.32
0.60
0.28
Unfair to Individuals
up 1
3
4
+0.69
0.39
-0.30
Less Freedom
up 1
4
5
+0.50
0.11
-0.39
Overreliance
down 3
5
2
-0.22
0.09
0.31
Lose Job
unchanged
6
6
+0.14
-0.52
-0.66
Extinction
unchanged
7
7
-0.42
-1.30
-0.88
Fears of human extinction and personal job loss came in last and next-to-last in both surveys. These were widely discussed scenarios, but interestingly - not the most strongly feared.
Of growing concern to Americans were: less freedom for individuals, greater unfairness and increasing income inequality.
Americans’ top fear remained unchanged from 2021 to 2023. They feared that AI would be controlled by people who are greedy, selfish or irresponsible.
4.2 Survey Items, Respondents and Costs
4.2.1 Survey Items
Respondents were asked: How much do you agree or disagree with each of the following statements?
These statements were presented in random order:
I fear that Artificial Intelligence will lead to less freedom for individuals.
I fear that Artificial Intelligence will lead to the extinction of human beings.
I fear that Artificial Intelligence will lead to individuals being treated unfairly.
I fear that Artificial Intelligence will lead to me losing my job involuntarily.
I fear that Artificial Intelligence will lead to more income inequality.
I fear that Artificial Intelligence will be controlled by people who are greedy, selfish or irresponsible.
I fear that as a society we will come to rely on Artificial Intelligence, and then it will fail catastrophically.
Respondents chose one of seven points, ranging from Strongly disagree to Strongly agree.
4.2.2 Respondents
Respondents were recruited through Prolific Academic. I requested a representative sample of 500 American adults. Specifically, I chose the option “USA, Factors: Sex, Age, Ethnicity (Simplified US Census).”
To demonstrate the demographic coverage, below I provide the Sex and Age crosstab for the 2023 sample:
Code
library(knitr)# Bin ages.demosTable2023Fears = responses %>%rename(Age_Raw = Age) %>%select(Sex, Age_Raw)demosTable2023Fears = demosTable2023Fears %>%mutate(Age ="UNKNOWN" ) %>%mutate(Age =if_else(Age_Raw >=18& Age_Raw <25, "18-24", Age) ) %>%mutate(Age =if_else(Age_Raw >=25& Age_Raw <35, "25-34", Age) ) %>%mutate(Age =if_else(Age_Raw >=35& Age_Raw <45, "35-44", Age) ) %>%mutate(Age =if_else(Age_Raw >=45& Age_Raw <55, "45-54", Age) ) %>%mutate(Age =if_else(Age_Raw >=55& Age_Raw <65, "55-64", Age) ) %>%mutate(Age =if_else(Age_Raw >=65, "65+", Age) )# Generate percentage per demographic bin for each survey sample.demosTable2023Fears = demosTable2023Fears %>%filter(!is.na(Sex), !is.na(Age)) %>%group_by(Sex, Age) %>%summarise(groupN =n() ) %>%# Add totalN.ungroup() %>%mutate(totalN =sum(groupN) ) %>%# Now we can divide across each row to calculate a percentage.mutate(percent =round(100* groupN / totalN, 0) ) %>%select(-totalN)kable(demosTable2023Fears, format ="markdown")
Table 4.2
Sex
Age
groupN
percent
Female
18-24
23
5
Female
25-34
56
11
Female
35-44
40
8
Female
45-54
46
9
Female
55-64
62
12
Female
65+
30
6
Male
18-24
32
6
Male
25-34
47
9
Male
35-44
51
10
Male
45-54
34
7
Male
55-64
43
9
Male
65+
35
7
4.2.3 Costs
The following numbers are for the 2023 wave.
Each respondent was paid $0.60. Thus, the total of payments to respondents was $300 = 500 * $0.60.
Prolific Academic charged a Service fee equal to 33% of respondent payments. This totaled $100.
Prolific Academic charged a special, large Representative sample fee to ensure the sample more closely matched the US population. For 500 participants, the fee was $704.09.
Thus, the total cost of the 2023 wave was $1,104.09.
R code for analysis and visualization is embedded above (some formats) or available at TODO GITHUB/ZENODO.
4.5 Summary and What’s Next
A clear and consistent message emerged from these results: Americans were not afraid of what the machines would do. They feared that AI’s human masters cared little for others.