# Download the 2021 and 2023 data.
# https://osf.io/download/r4xd9/ and https://osf.io/download/szkuq/
responses2021 = read_csv("data/google-surveys-agi-2021-results.csv")
responses2023 = read_csv("data/prolific-agi-2023-results.csv")
# Select the columns I want.
responses2021 = responses2021 %>% select(Prompt, Response, Year, Sex, Age)
responses2023 = responses2023 %>% select(Prompt, Response, Year, Sex, Age)
# Add Short_Prompt.
responses2021 = responses2021 %>%
mutate(Short_Prompt = Prompt) %>%
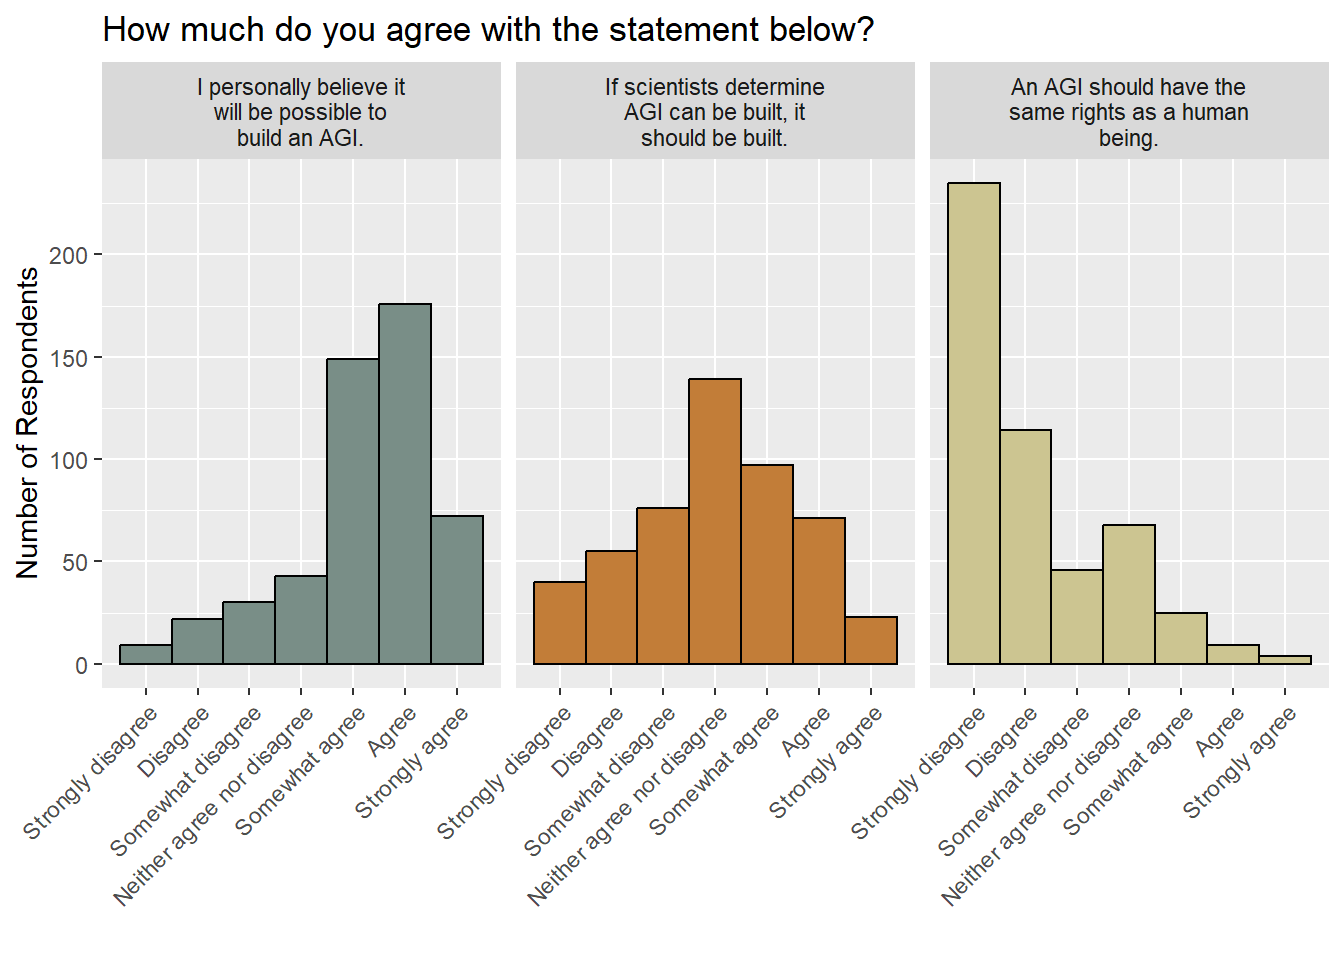
mutate(Short_Prompt = ifelse(grepl("I personally believe it will be possible to build an AGI.", Short_Prompt), "Possible to build", Short_Prompt)) %>%
mutate(Short_Prompt = ifelse(grepl("If scientists determine AGI can be built, it should be built.", Short_Prompt), "Should be built", Short_Prompt)) %>%
mutate(Short_Prompt = ifelse(grepl("An AGI should have the same rights as a human being.", Short_Prompt), "Same rights as a human", Short_Prompt))
responses2023 = responses2023 %>%
mutate(Short_Prompt = Prompt) %>%
mutate(Short_Prompt = ifelse(grepl("I personally believe it will be possible to build an AGI.", Short_Prompt), "Possible to build", Short_Prompt)) %>%
mutate(Short_Prompt = ifelse(grepl("If scientists determine AGI can be built, it should be built.", Short_Prompt), "Should be built", Short_Prompt)) %>%
mutate(Short_Prompt = ifelse(grepl("An AGI should have the same rights as a human being.", Short_Prompt), "Same rights as a human", Short_Prompt))
# Explicitly set types and factor levels.
responses2021$Prompt = factor(responses2021$Prompt, levels=c("I personally believe it will be possible to build an AGI.", "If scientists determine AGI can be built, it should be built.", "An AGI should have the same rights as a human being."), ordered = FALSE)
responses2023$Prompt = factor(responses2023$Prompt, levels=c("I personally believe it will be possible to build an AGI.", "If scientists determine AGI can be built, it should be built.", "An AGI should have the same rights as a human being."), ordered = FALSE)
responses2021$Sex = as.factor(responses2021$Sex)
responses2023$Sex = as.factor(responses2023$Sex)
responses2021$Age = as.ordered(responses2021$Age)
responses2023$Age = as.ordered(responses2023$Age)
# Short_Prompt is a factor. Make 'Possible to build' the reference level.
responses2021$Short_Prompt = factor(responses2021$Short_Prompt, levels=c("Possible to build", "Should be built", "Same rights as a human"), ordered = FALSE)
responses2023$Short_Prompt = factor(responses2023$Short_Prompt, levels=c("Possible to build", "Should be built", "Same rights as a human"), ordered = FALSE)
# Stack the files.
responses = bind_rows(responses, responses2021)
responses = bind_rows(responses, responses2023)
# Create the temporal trends figure
responses %>%
group_by(Year, Short_Prompt) %>%
summarise(
Mean_Response = mean(Response),
sd = sd(Response),
n = n(),
se = sd / sqrt(n),
error_low = Mean_Response - se,
error_high = Mean_Response + se
) %>%
ggplot(aes(x = Year, y = Mean_Response, color = Short_Prompt, shape = Short_Prompt)) +
# Add green and red shading to demarcate agree vs disagree.
annotate(geom="rect", xmin=-Inf, xmax=Inf, ymin=0.0, ymax=Inf, fill="green", alpha=0.1) +
annotate(geom="rect", xmin=-Inf, xmax=Inf, ymin=-Inf, ymax=0.0, fill="red", alpha=0.1) +
# Annotations go first, so data elements are layered on top.
#geom_point(size=5) +
geom_line(aes(color = Short_Prompt), arrow = arrow(angle = 10, type = "closed") ) +
#geom_errorbar(aes(ymin = error_low, ymax = error_high), color="black", width=0.1, alpha=0.7) +
geom_errorbar(aes(ymin = error_low, ymax = error_high), width=0.1, alpha=0.7) +
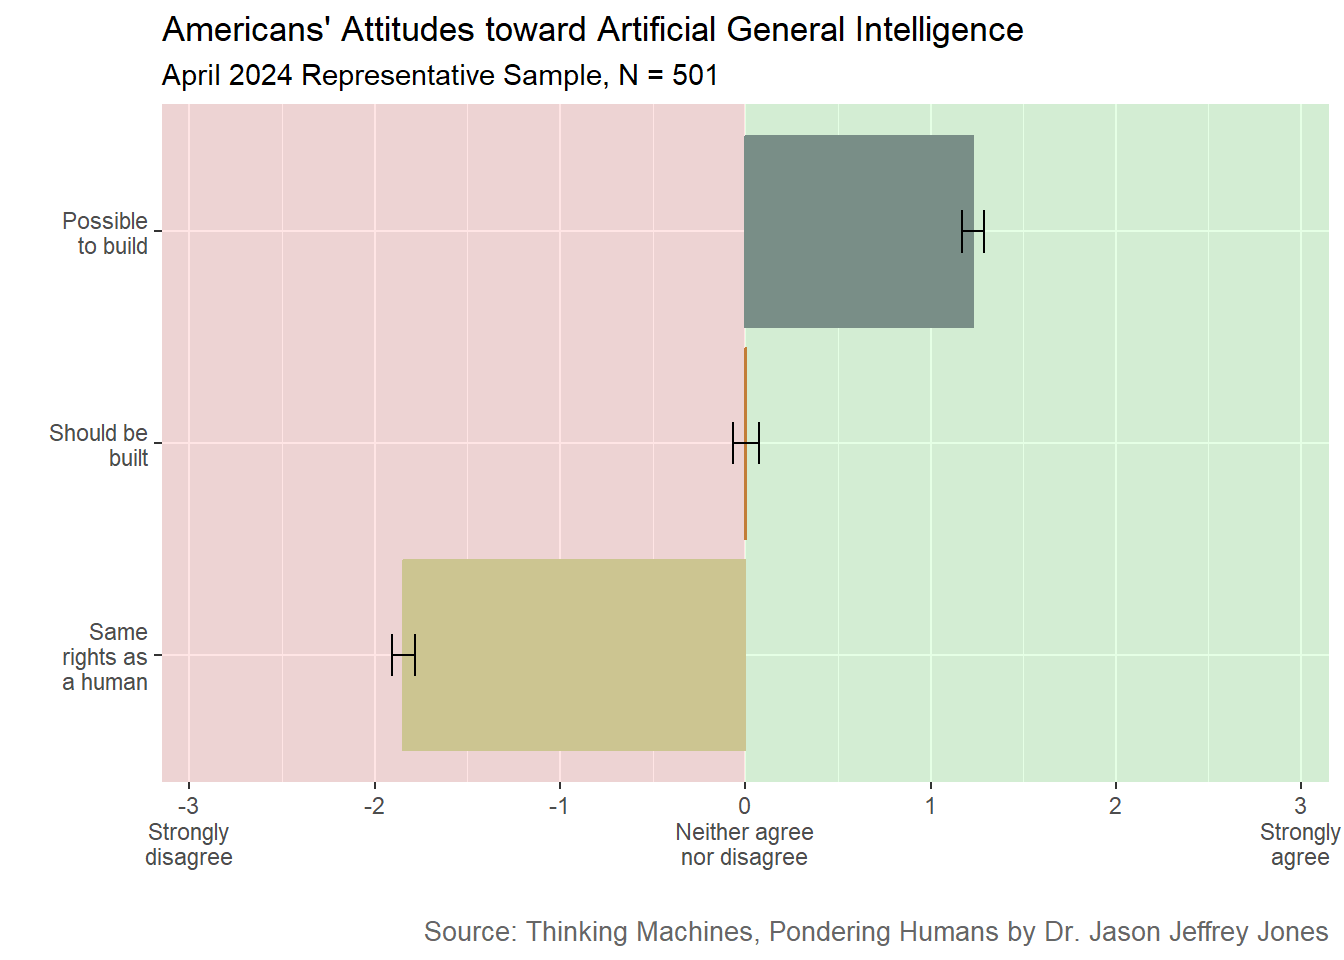
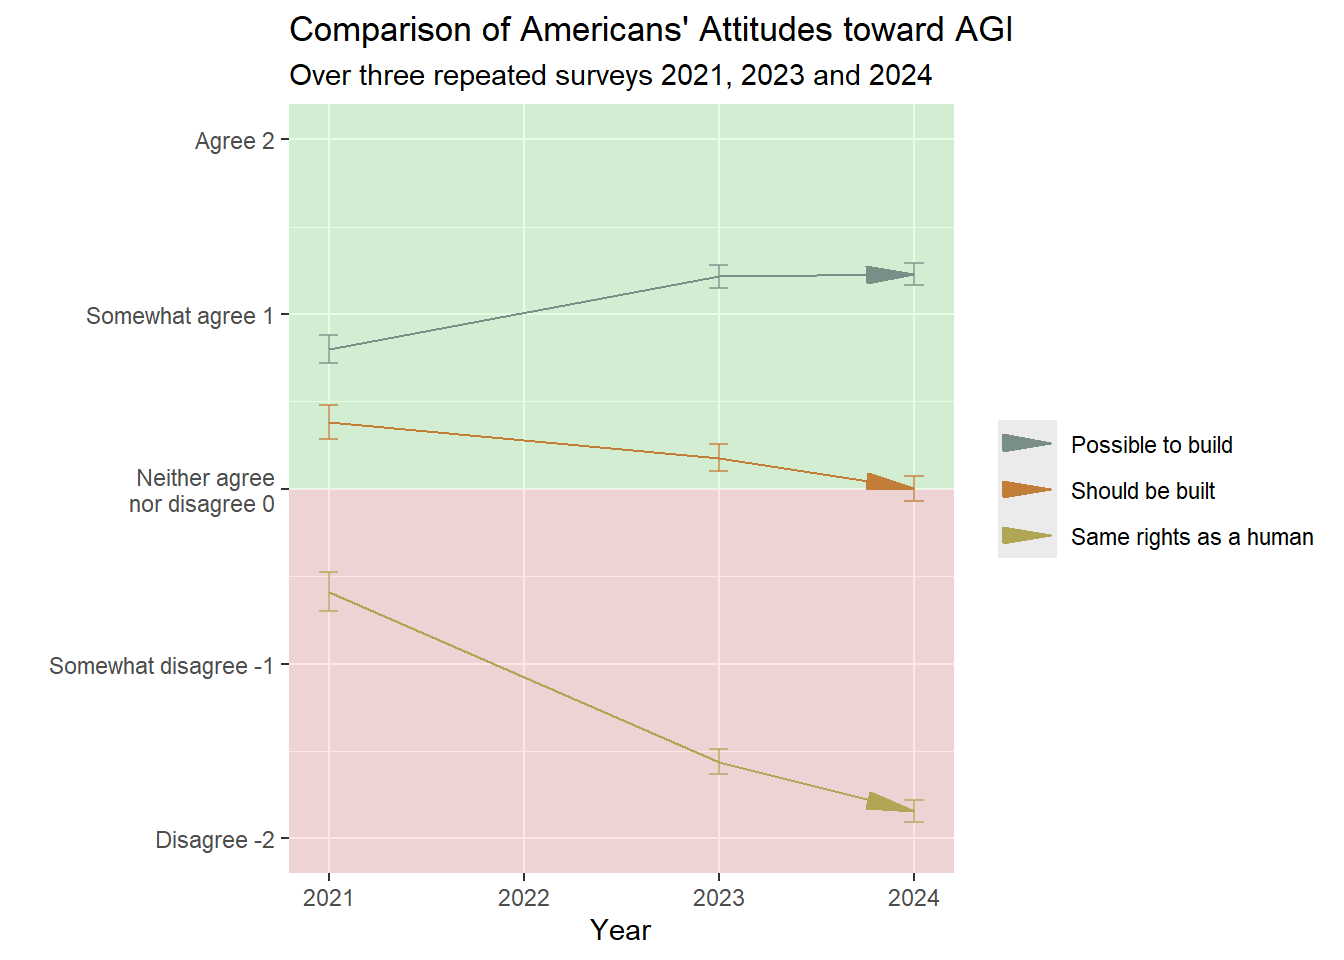
ggtitle("Comparison of Americans' Attitudes toward AGI", "Over three repeated surveys 2021, 2023 and 2024") +
xlab("Year") + ylab("") +
scale_x_continuous(breaks = 2021:2024, minor_breaks = NULL) +
scale_y_continuous(limits = c(-2,2), breaks = -2:2, labels = c("Disagree -2", "Somewhat disagree -1", "Neither agree\nnor disagree 0", "Somewhat agree 1", "Agree 2")) +
# Keep the legend, but no title.
theme(legend.title=element_blank()) +
# Set color and fill values.
# For this visualization we made #CCC591 25% darker to #b0a655
scale_color_manual(values = c("Possible to build" = "#798E87", "Should be built" = "#C27D38", "Same rights as a human" = "#b0a655"))