How did opinions toward artificial general intelligence (AGI) vary among different sets of people?
Before you look at the results, try to predict where (and if) we will see big differences. Will it be an individual’s sex or age that best predicts their opinion? Or will it be how trusting of others or willing to take risks an individual is? Maybe political party affiliation will be the schism which separates opinions.
Read on to find out!
3.1 Sex
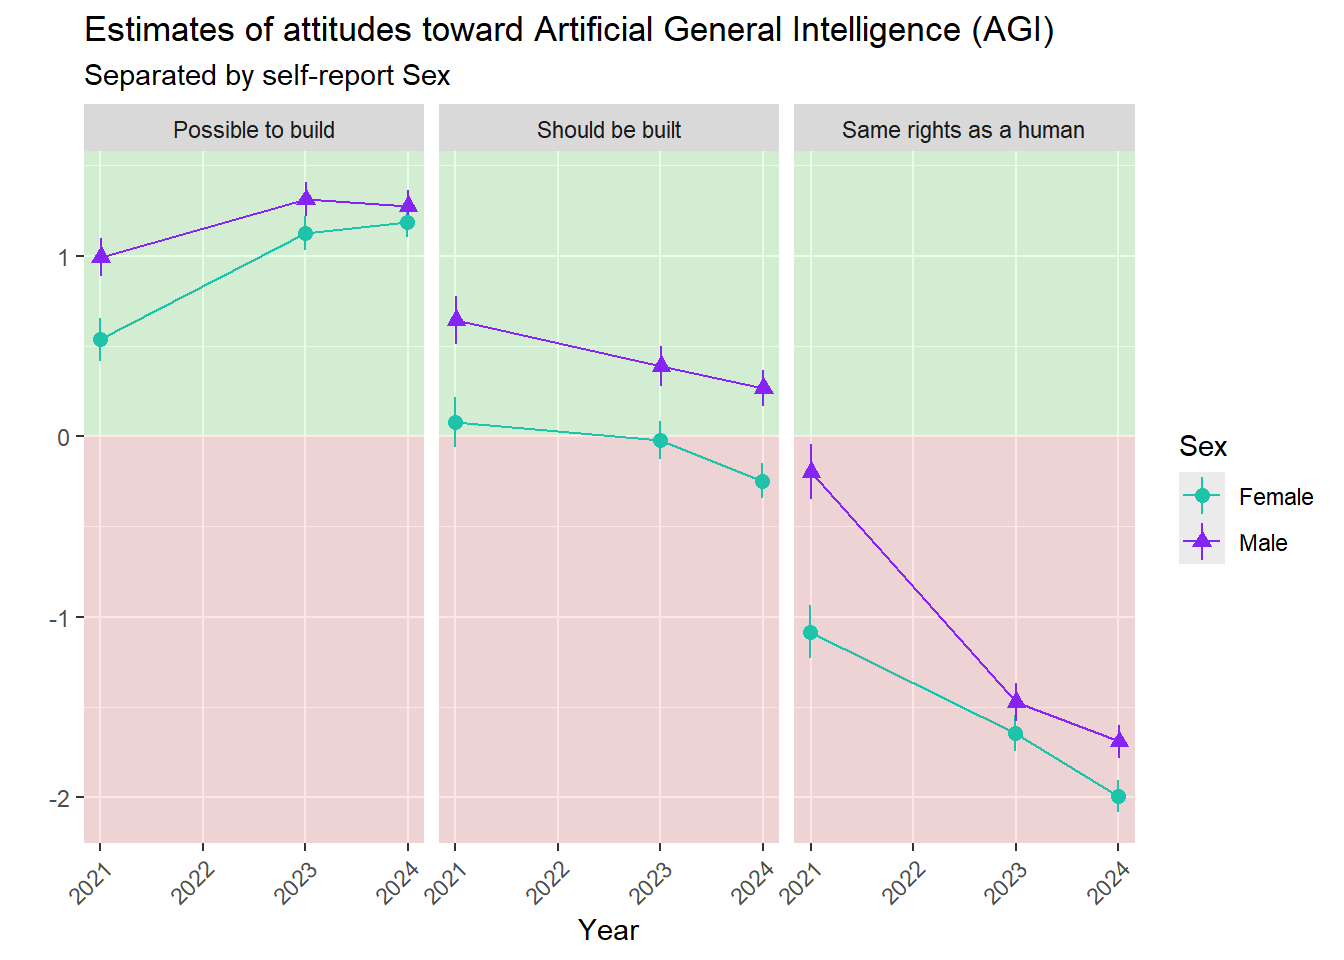
Respondents self-reported Sex by choosing Female or Male. As you can see below, both sexes followed the same trajectory over time.
Code
library(tidyverse)library(scales)# The file prolific-agi-2024-results.csv contains responses from a US representative sample of 501 respondents.# Download the file from a public Open Science Framework repository at https://osf.io/download/cgx7m/responses =read_csv("data/prolific-agi-2024-results.csv")# Download the 2021 and 2023 data.# https://osf.io/download/r4xd9/ and https://osf.io/download/szkuq/responses2021 =read_csv("data/google-surveys-agi-2021-results.csv")responses2023 =read_csv("data/prolific-agi-2023-results.csv")# Select the columns I want.responses2021 = responses2021 %>%select(Prompt, Response, Year, Sex, Age)responses2023 = responses2023 %>%select(Prompt, Response, Year, Sex, Age)# Stack the files.responses =bind_rows(responses, responses2021)responses =bind_rows(responses, responses2023)# Add the Short_Prompt column.responses = responses %>%mutate(Short_Prompt = Prompt) %>%mutate(Short_Prompt =ifelse(grepl("I personally believe it will be possible to build an AGI.", Short_Prompt), "Possible to build", Short_Prompt)) %>%mutate(Short_Prompt =ifelse(grepl("If scientists determine AGI can be built, it should be built.", Short_Prompt), "Should be built", Short_Prompt)) %>%mutate(Short_Prompt =ifelse(grepl("An AGI should have the same rights as a human being.", Short_Prompt), "Same rights as a human", Short_Prompt))# Explicitly set types and factor levels.responses$Prompt =factor(responses$Prompt, levels=c("I personally believe it will be possible to build an AGI.", "If scientists determine AGI can be built, it should be built.", "An AGI should have the same rights as a human being."), ordered =FALSE)responses$Sex =as.factor(responses$Sex)responses$Age =as.ordered(responses$Age)# Short_Prompt is a factor. Make 'Possible to build' the reference level.responses$Short_Prompt =factor(responses$Short_Prompt, levels=c("Possible to build", "Should be built", "Same rights as a human"), ordered =FALSE)# Create a temporal trends by Sex figureresponses %>%group_by(Short_Prompt, Year, Sex) %>%summarise(Mean_Response =mean(Response),sd =sd(Response),n =n(),se = sd /sqrt(n),error_low = Mean_Response - se,error_high = Mean_Response + se ) %>%ggplot(aes(x = Year, y = Mean_Response, shape=Sex, color=Sex, group=Sex)) +annotate(geom="rect", xmin=-Inf, xmax=Inf, ymin=0.0, ymax=Inf, fill="green", alpha=0.1) +annotate(geom="rect", xmin=-Inf, xmax=Inf, ymin=-Inf, ymax=0.0, fill="red", alpha=0.1) +geom_pointrange(aes(ymin = error_low, ymax = error_high), position =position_dodge(width =0.02)) +geom_line(position =position_dodge(width =0.02)) +scale_x_continuous(breaks =2021:2024, minor_breaks =NULL, guide =guide_axis(angle =45)) +#scale_y_continuous(limits = c(-1.75,1.6), breaks = -1:1, labels = c("Somewhat disagree -1", "Neither agree nor disagree 0", "Somewhat agree 1")) +facet_wrap(~ Short_Prompt, nrow=1) +# Set color and fill values.scale_color_manual(values =c("Female"="#1FC3AA", "Male"="#8624F5")) +ggtitle("Estimates of attitudes toward Artificial General Intelligence (AGI)", "Separated by self-report Sex") +xlab("Year") +ylab("")# For each item, let's estimate the direction of effect over Year and Sex.fit_possible = responses %>%# Make 2021 year zero, so that the model isn't estimating early Christians' attitudes for the intercept.mutate(Year = Year -2021) %>%filter(Short_Prompt =="Possible to build") %>%lm(Response ~ Year * Sex, data = .)summary(fit_possible)confint(fit_possible)# See text for interpretation.fit_should = responses %>%# Make 2021 year zero, so that the model isn't estimating early Christians' attitudes for the intercept.mutate(Year = Year -2021) %>%filter(Short_Prompt =="Should be built") %>%lm(Response ~ Year * Sex, data = .)summary(fit_should)confint(fit_should)# See text for interpretation.fit_rights = responses %>%# Make 2021 year zero, so that the model isn't estimating early Christians' attitudes for the intercept.mutate(Year = Year -2021) %>%filter(Short_Prompt =="Same rights as a human") %>%lm(Response ~ Year * Sex, data = .)summary(fit_rights)confint(fit_rights)# See text for interpretation.
Figure 3.1: Estimates of AGI attitudes by Sex over time based on three representative sample surveys of American adults. Note that 0 on the y-axis represents ‘Neither agree nor disagree’. +1 corresponds to ‘Somewhat agree’, and -2 corresponds to ‘Disagree’. Refer to the previous chapter for aggregate results.
Further analysis supports the following claims:
On average, Males more strongly agreed building AGI was possible.
On average, Females agreed more weakly that AGI should be built.
On average, neither Males nor Females ever agreed that an AGI should have the same rights as a human. The slight difference due to Sex shrank from 2021 to 2024.
3.2 Age
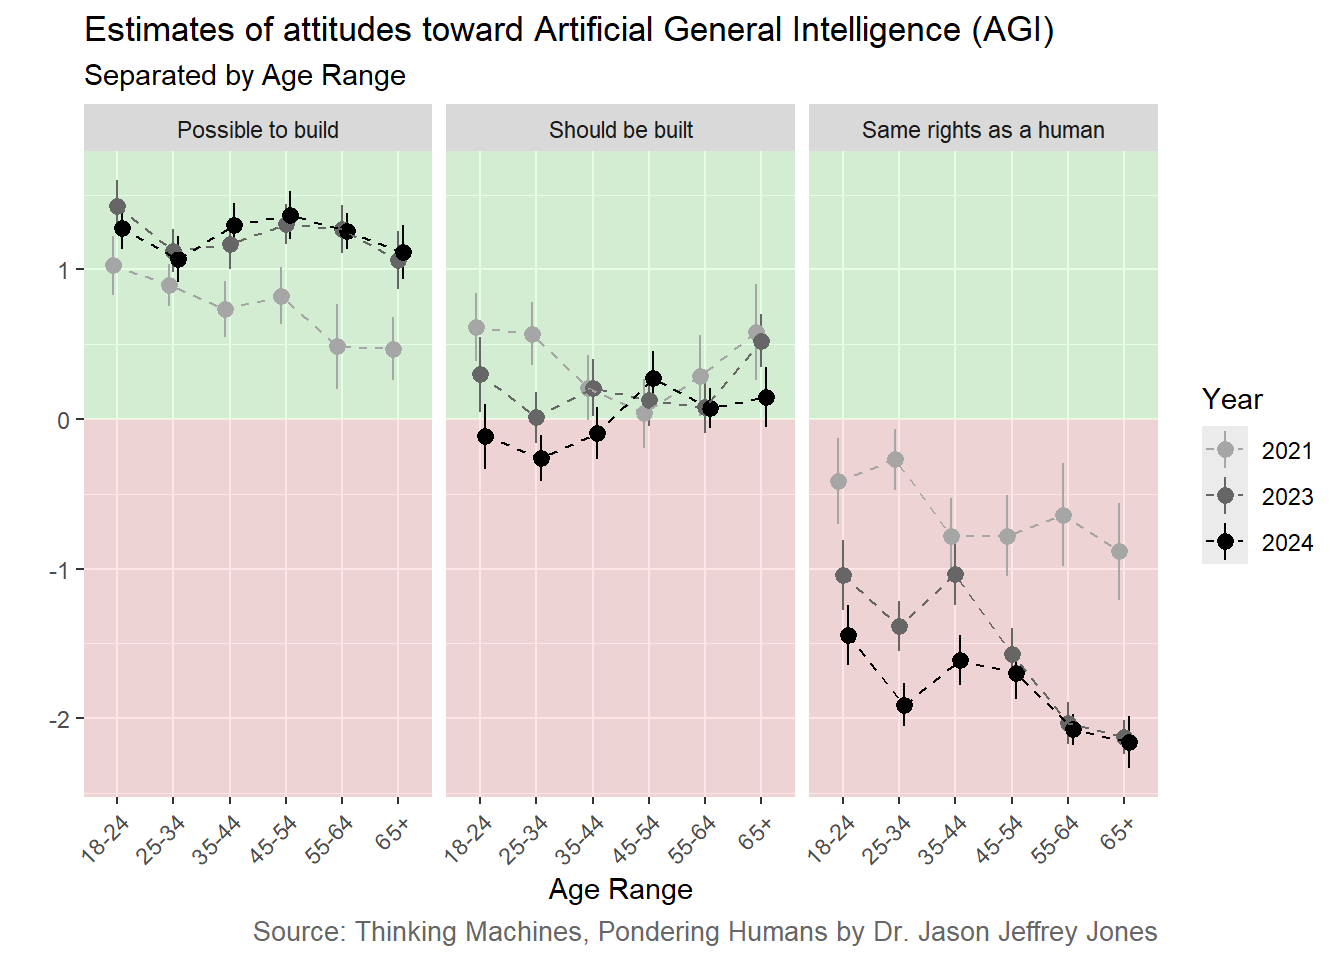
Respondents self-reported their age in years. To reduce complexity, I bucketed ages by decades. Look at the graphs below, and focus on the movement of young people over time. The darker the line, the more recent the survey. Age is on the x-axis (younger to older).
Code
# Create a temporal trends by Age figureresponses %>%mutate(Year =as.character(Year)) %>%group_by(Short_Prompt, Year, Age) %>%summarise(Mean_Response =mean(Response),sd =sd(Response),n =n(),se = sd /sqrt(n),error_low = Mean_Response - se,error_high = Mean_Response + se ) %>%ggplot(aes(x = Age, y = Mean_Response, color=Year, group=Year)) +annotate(geom="rect", xmin=-Inf, xmax=Inf, ymin=0.0, ymax=Inf, fill="green", alpha=0.1) +annotate(geom="rect", xmin=-Inf, xmax=Inf, ymin=-Inf, ymax=0.0, fill="red", alpha=0.1) +geom_pointrange(aes(ymin = error_low, ymax = error_high), position =position_dodge(width =0.25)) +geom_line(linetype ="dashed", position =position_dodge(width =0.25)) +scale_x_discrete(guide =guide_axis(angle =45) ) +#scale_y_continuous(limits = c(-2.25,1.6), breaks = -2:1, labels = c("Disagree -2", "Somewhat disagree -1", "Neither agree nor disagree 0", "Somewhat agree 1")) +facet_wrap(~ Short_Prompt, nrow=1) +# Set color and fill values.scale_color_manual(values =c("2021"="gray65", "2023"="gray40", "2024"="black")) +ggtitle("Estimates of attitudes toward Artificial General Intelligence (AGI)", "Separated by Age Range") +xlab("Age Range") +ylab("") +labs(caption ="Source: Thinking Machines, Pondering Humans by Dr. Jason Jeffrey Jones") +theme(plot.caption =element_text(size=10, color ="#666666"))# For each item, let's estimate the direction of effect over Year and Sex.fit_possible_age = responses %>%# Make 2021 year zero, so that the model isn't estimating early Christians' attitudes for the intercept.mutate(Year = Year -2021) %>%filter(Short_Prompt =="Possible to build") %>%lm(Response ~ Year * Age, data = .)summary(fit_possible_age)confint(fit_possible_age)# See text for interpretation.fit_should_age = responses %>%# Make 2021 year zero, so that the model isn't estimating early Christians' attitudes for the intercept.mutate(Year = Year -2021) %>%filter(Short_Prompt =="Should be built") %>%lm(Response ~ Year * Age, data = .)summary(fit_should_age)confint(fit_should_age)# See text for interpretation.fit_rights_age = responses %>%# Make 2021 year zero, so that the model isn't estimating early Christians' attitudes for the intercept.mutate(Year = Year -2021) %>%filter(Short_Prompt =="Same rights as a human") %>%lm(Response ~ Year * Age, data = .)summary(fit_rights_age)confint(fit_rights_age)# See text for interpretation.
Figure 3.2: Estimates of AGI attitudes by Age over time based on three representative sample surveys of American adults. Note that 0 on the y-axis represents ‘Neither agree nor disagree’. +1 corresponds to ‘Somewhat agree’, and -2 corresponds to ‘Disagree’. Refer to the previous chapter for aggregate results.
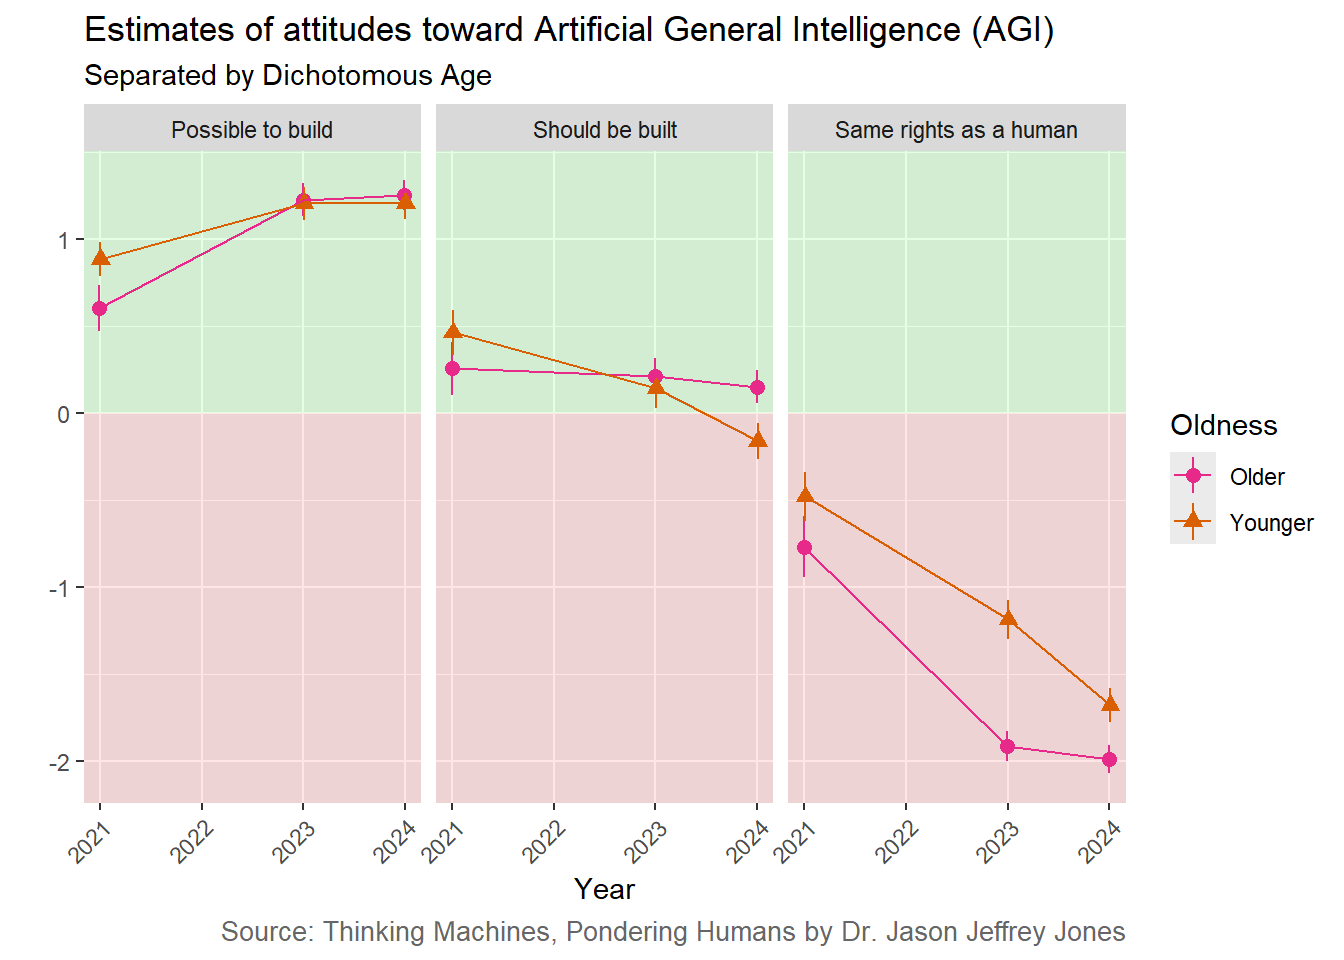
I know I said I had reduced complexity, but the figure above is still too busy. Let’s simplify by dichotomizing age into two buckets. We will call ages 18-44 Younger and 45 and above Older. With only two categories, we can gain some statistical power and inspect simpler plots similar to the one above for Sex and the one below for Trust.
Code
# Create a temporal trends by Oldness figureresponses %>%mutate(Oldness =ifelse(Age %in%c("18-24", "25-34", "35-44"), "Younger", "Older") ) %>%group_by(Short_Prompt, Year, Oldness) %>%summarise(Mean_Response =mean(Response),sd =sd(Response),n =n(),se = sd /sqrt(n),error_low = Mean_Response - se,error_high = Mean_Response + se ) %>%ggplot(aes(x = Year, y = Mean_Response, shape=Oldness, color=Oldness, group=Oldness)) +annotate(geom="rect", xmin=-Inf, xmax=Inf, ymin=0.0, ymax=Inf, fill="green", alpha=0.1) +annotate(geom="rect", xmin=-Inf, xmax=Inf, ymin=-Inf, ymax=0.0, fill="red", alpha=0.1) +geom_pointrange(aes(ymin = error_low, ymax = error_high), position =position_dodge(width =0.02)) +geom_line(position =position_dodge(width =0.02)) +scale_x_continuous(breaks =2021:2024, minor_breaks =NULL, guide =guide_axis(angle =45)) +facet_wrap(~ Short_Prompt, nrow=1) +# Set color and fill values.scale_color_manual(values =c("Younger"="#D95F02", "Older"="#E7298A")) +ggtitle("Estimates of attitudes toward Artificial General Intelligence (AGI)", "Separated by Dichotomous Age") +xlab("Year") +ylab("") +labs(caption ="Source: Thinking Machines, Pondering Humans by Dr. Jason Jeffrey Jones") +theme(plot.caption =element_text(size=10, color ="#666666"))# For each item, let's estimate the direction of effect over Year and Oldness.fit_possible_oldness = responses %>%# Make 2021 year zero, so that the model isn't estimating early Christians' attitudes for the intercept.mutate(Year = Year -2021) %>%mutate(Oldness =ifelse(Age %in%c("18-24", "25-34", "35-44"), "Younger", "Older") ) %>%filter(Short_Prompt =="Possible to build") %>%lm(Response ~ Year * Oldness, data = .)summary(fit_possible_oldness)confint(fit_possible_oldness)# See text for interpretation.fit_should_oldness = responses %>%# Make 2021 year zero, so that the model isn't estimating early Christians' attitudes for the intercept.mutate(Year = Year -2021) %>%mutate(Oldness =ifelse(Age %in%c("18-24", "25-34", "35-44"), "Younger", "Older") ) %>%filter(Short_Prompt =="Should be built") %>%lm(Response ~ Year * Oldness, data = .)summary(fit_should_oldness)confint(fit_should_oldness)# See text for interpretation.fit_rights_oldness = responses %>%# Make 2021 year zero, so that the model isn't estimating early Christians' attitudes for the intercept.mutate(Year = Year -2021) %>%mutate(Oldness =ifelse(Age %in%c("18-24", "25-34", "35-44"), "Younger", "Older") ) %>%filter(Short_Prompt =="Same rights as a human") %>%lm(Response ~ Year * Oldness, data = .)summary(fit_rights_oldness)confint(fit_rights_oldness)# See text for interpretation.
Figure 3.3: Replotting Age over Time with only two categories: Younger is 18-44 while Older is 45 and above.
However we slice it, age is not actually moving the needle very much. As we saw for Males and Females above, Older and Younger Americans are more similar than not in their attitudes toward AGI.
There is an interesting (statistically significant, but just barely) crossover interaction of age and time for Should be built. Alarm bells should be (faintly) ringing for AGI proponents; it may be that younger people are crossing over into opposition of developing this technology.
In the 2024 survey, I presented respondents additional items after the AGI attitude items. Each was a standard measure from previous academic work. The first was a single-item measure of generalized trust.
3.3 Trust
Some people are more trusting than others. As social scientists, we call this trait generalized trust. It has been measured many ways, but my favorite is very simple; it is one item with two possible responses:
Generally speaking, would you say that most people can be trusted or that you can’t be too careful in dealing with people?
For now, grant me that we can measure individuals’ willingness to trust others and that forcing a choice between the two poles is a valid, interesting method. We will call our respondents Trusting if they selected ‘Most people can be trusted.’ Those respondents who chose ‘You can’t be too careful in dealing with people,’ we will call Careful.
Note that we’ll look at results for 2024, because I did not include the Trust item in previous years.
Let’s look at some results!
Code
# The file agi-2024-wide-correlates.csv contains responses from a 2024 US representative sample of 501 respondents.# This file also contains demographics and responses to Trust, Risk and Political Party affiliation items.# Download the file from a public Open Science Framework repository at https://osf.io/download/jsc4n/responsesWideCorrelates =read_csv("data/agi-2024-wide-correlates.csv")responsesWideCorrelates = responsesWideCorrelates %>%mutate(Generalized_Trust =ifelse(Generalized_Trust =="Most people can be trusted.", "Trusting", "Careful") ) %>%mutate(Generalized_Trust =factor(Generalized_Trust, levels =c("Careful", "Trusting")) )# View counts and proportions.proportions = responsesWideCorrelates %>%count(Generalized_Trust) %>%mutate(Proportion = n /sum(n)) %>%mutate(Generalized_Trust =factor(Generalized_Trust, levels =c("Trusting", "Careful"))) %>%# Add text annotation to replace Legend. Include label \n count.mutate(Bar_Label =paste0(Generalized_Trust, "\n", "n = ", n) )#proportionsproportions %>%ggplot( aes(x = Proportion, y ="", fill = Generalized_Trust)) +geom_bar(stat ="identity", width =0.1, show.legend =FALSE ) +ggtitle("Proportion of Generalized Trust Responses") +xlab("Proportion") +ylab(NULL) +scale_x_continuous(labels = scales::percent, expand =expansion(0,0) ) +scale_y_discrete(, expand =expansion(0,0)) +scale_fill_manual(values =c("Careful"="#0047AB", "Trusting"="darkorange4")) +geom_text(aes(label = Bar_Label), position =position_fill(vjust =0.5), size =24/.pt) +theme(aspect.ratio =0.25)
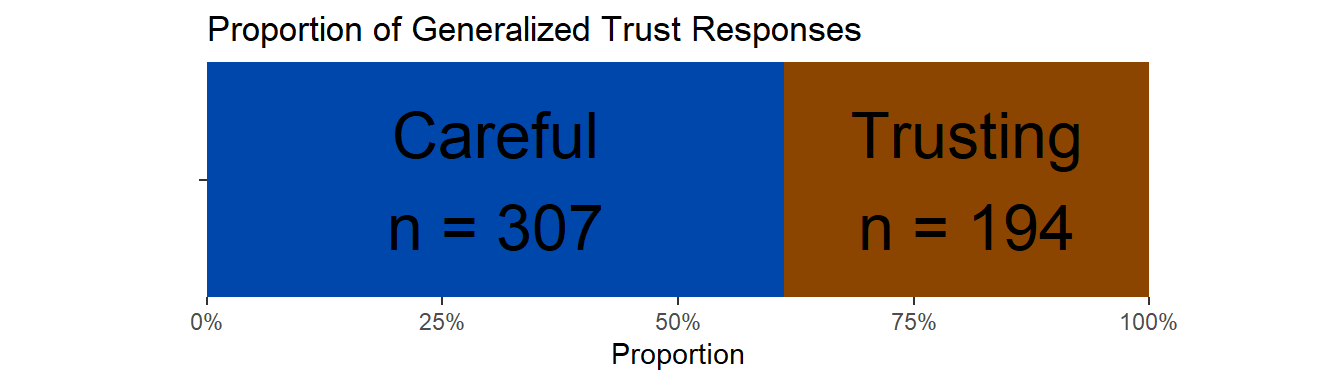
Figure 3.4: More respondents were ‘Careful’ (307) than ‘Trusting’ (194).
We see that more respondents were Careful (307) than Trusting (194).
Now let’s see what difference generalized trust made. (I only included the generalized trust item on the most recent wave of the survey; the following results are for 2024.)
Code
# Pivot longer and add the Short_Prompt column.generalizedTrust = responsesWideCorrelates %>%select(Generalized_Trust, Possible, Should, Rights) %>%pivot_longer(cols =c("Possible", "Should", "Rights"), names_to ="Short_Prompt", values_to ="Response" ) %>%mutate(Short_Prompt =ifelse(Short_Prompt =="Possible", "Possible to build", Short_Prompt) ) %>%mutate(Short_Prompt =ifelse(Short_Prompt =="Should", "Should be built", Short_Prompt)) %>%mutate(Short_Prompt =ifelse(Short_Prompt =="Rights", "Same rights as a human", Short_Prompt)) %>%mutate(Short_Prompt =factor(Short_Prompt, levels=c("Possible to build", "Should be built", "Same rights as a human"), ordered =FALSE) )# TODO this could look better with all on one axis, flipped.# Create a Careful versus Trusting figuregeneralizedTrust %>%group_by(Short_Prompt, Generalized_Trust) %>%summarise(Mean_Response =mean(Response),sd =sd(Response),n =n(),se = sd /sqrt(n),error_low = Mean_Response - se,error_high = Mean_Response + se ) %>%ggplot(aes(x = Generalized_Trust, y = Mean_Response, shape=Generalized_Trust, color=Generalized_Trust, group=Generalized_Trust)) +annotate(geom="rect", xmin=-Inf, xmax=Inf, ymin=0.0, ymax=Inf, fill="green", alpha=0.1) +annotate(geom="rect", xmin=-Inf, xmax=Inf, ymin=-Inf, ymax=0.0, fill="red", alpha=0.1) +geom_pointrange(aes(ymin = error_low, ymax = error_high), linewidth =1 ) +#scale_y_continuous(limits = c(-1.75,1.6), breaks = -1:1, labels = c("Somewhat disagree -1", "Neither agree nor disagree 0", "Somewhat agree 1")) +scale_color_manual(values =c("Careful"="#0047AB", "Trusting"="darkorange4")) +ggtitle("Estimates of attitudes toward Artificial General Intelligence (AGI)", "Separated by self-report Generalized Trust") +xlab("") +ylab("") +theme(legend.position ="none") +facet_wrap(~ Short_Prompt, nrow=1)# For each item, let's estimate the association with Generalized Trust.fit_possible = generalizedTrust %>%filter(Short_Prompt =="Possible to build") %>%lm(Response ~ Generalized_Trust, data = .)summary(fit_possible)confint(fit_possible)# See text for interpretation.fit_should = generalizedTrust %>%filter(Short_Prompt =="Should be built") %>%lm(Response ~ Generalized_Trust, data = .)summary(fit_should)confint(fit_should)# See text for interpretation.fit_rights = generalizedTrust %>%filter(Short_Prompt =="Same rights as a human") %>%lm(Response ~ Generalized_Trust, data = .)summary(fit_rights)confint(fit_rights)# See text for interpretation.
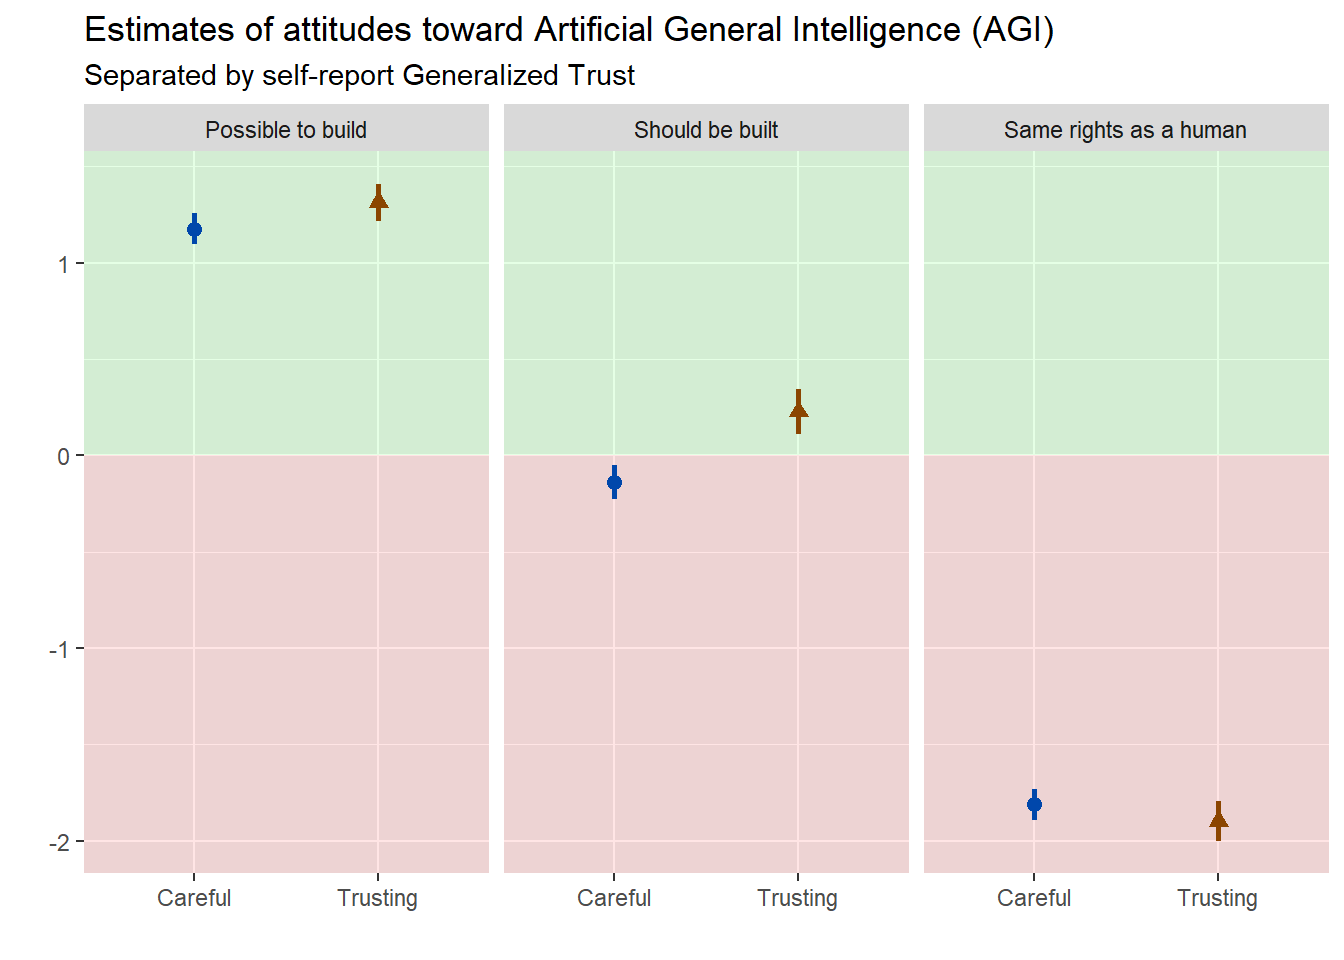
Figure 3.5: Generalized trust category as predictor for AGI attitudes. Careful and Trusting individuals responded similarly - except for the item ‘Should be built.’ Trusting respondents were more likely to agree that AGI should be built (p < 0.05).
Careful and Trusting individuals responded similarly - except for the item Should be built. Trusting respondents agreed more strongly that AGI should be built (p < 0.05).
3.4 Risk
Many people avoid risk, while others tolerate or even seek it out. I hypothesized that risk-averse individuals would differ in their attitudes toward AGI, so I looked for a single-item individual risk preference measurement tool. I found one in the general risk question:
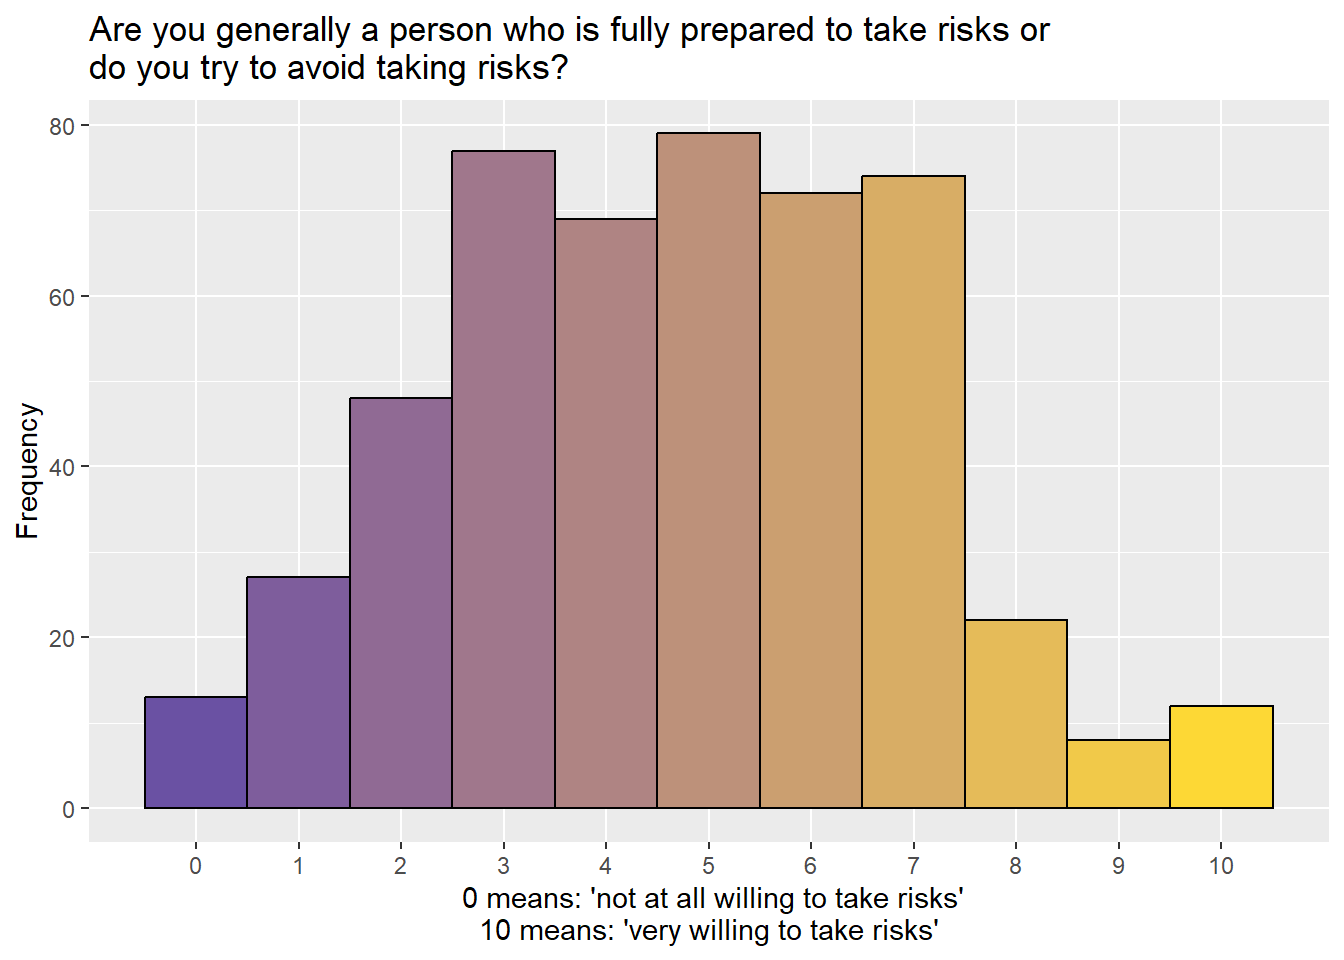
How do you see yourself: are you generally a person who is fully prepared to take risks or do you try to avoid taking risks? Please choose a number, where the value 0 means: ‘not at all willing to take risks’ and the value 10 means: ‘very willing to take risks’.
Of course, there are arguments about the best way to measure individual differences in willingness to take risks. I am content with the above, after having read Individual Risk Attitudes: Measurement, Determinants, and Behavioral Consequences. In the 2011 article, Dohmen et al. argue the general risk question “generates the best all-round predictor of risky behavior.”
For now, grant me that we can measure individuals’ willingness to take risks and that self-report on a 0 to 10 scale is a valid, interesting method. Using the data, we can observe the relationship between risk and AGI attitudes.
First, let’s examine the variation in responses to the general risk question.
Code
# Let's look at variability in risk responses.responsesWideCorrelates %>%ggplot(aes(x = Risk_Preference, fill = ..x..)) +geom_histogram(binwidth =1, color ="black") +scale_fill_gradient(low ="#6a51a3", high ="#fdd835") +ggtitle("Are you generally a person who is fully prepared to take risks or\ndo you try to avoid taking risks?") +xlab(" 0 means: 'not at all willing to take risks'\n10 means: 'very willing to take risks'") +ylab("Frequency") +scale_x_continuous(breaks =0:10, labels =as.character(0:10) ) +theme(panel.grid.minor.x =element_blank()) +theme(legend.position ="none")
Figure 3.6: The distribution of responses to the general risk question. Most respondents chose low to medium values, and a few chose high values (very willing to take risks).
Most of these American adult respondents chose low to medium values; only a few chose high values (very willing to take risks). We won’t have a lot of precision in our estimates for extreme values (0 and 10), but that’s OK.
Let’s inspect respondents’ agreement with each AGI statement as a function of willingness to take risks.
Code
responsesWideCorrelates %>%select(Risk_Preference, Possible, Should, Rights) %>%pivot_longer(!Risk_Preference, names_to ="Short_Prompt", values_to ="Response") %>%group_by(Short_Prompt, Risk_Preference) %>%summarise(Response_Mean =mean(Response), sd =sd(Response),n =n(),se = sd /sqrt(n),error_low = Response_Mean - se,error_high = Response_Mean + se) %>%mutate(Short_Prompt =factor(Short_Prompt, levels=c("Possible", "Should", "Rights"),labels=c("Possible to build", "Should be built", "Same rights as a human"), ordered =FALSE)) %>%ggplot(aes(x = Risk_Preference, y = Response_Mean, color = Short_Prompt, shape = Short_Prompt)) +# Add green and red shading to demarcate agree vs disagree.annotate(geom="rect", xmin=-Inf, xmax=Inf, ymin=0.0, ymax=Inf, fill="green", alpha=0.1) +annotate(geom="rect", xmin=-Inf, xmax=Inf, ymin=-Inf, ymax=0.0, fill="red", alpha=0.1) +# Annotations go first, so data elements are layered on top.geom_point() +geom_errorbar(aes(ymin = error_low, ymax = error_high), width=0.1, alpha=0.7) +geom_smooth(method ="lm", se =FALSE) +ggtitle("Estimates of attitudes toward Artificial General Intelligence (AGI)", "As a function of Stated Risk Preference") +xlab("Stated Risk Preference\n0 means: 'not at all willing to take risks'\n10 means: 'very willing to take risks'") +#ylab("Mean Response\n(Bars depict one standard error)") +ylab("") +scale_x_continuous(breaks =0:10, labels =as.character(0:10) ) +# Force full y scale to -3 through +3. Add numbers and labels.scale_y_continuous(limits =c(-3,3), breaks =-3:3, labels =c("Strongly disagree = -3", "Disagree = -2", "Somewhat disagree = -1", "Neither agree nor disagree = 0", "Somewhat agree = 1", "Agree = 2", "Strongly agree = 3")) +theme(panel.grid.minor.x =element_blank()) +# Keep the legend, but no title.theme(legend.title=element_blank(),legend.position =c(0.3, 0.86),#legend.justification = c(0.5, 1), # Align the legend center at the toplegend.background =element_rect(fill ="white", color ="black") ) +# Set color and fill values.# For this visualization we made #CCC591 25% darker to #b0a655scale_color_manual(values =c("Possible to build"="#798E87", "Should be built"="#C27D38", "Same rights as a human"="#b0a655")) +labs(caption ="Source: Thinking Machines, Pondering Humans by Dr. Jason Jeffrey Jones") +theme(plot.caption =element_text(size=10, color ="#666666"))# For each item, let's estimate the association with Risk.fit_possible = responsesWideCorrelates %>%select(Risk_Preference, Possible) %>%lm(Possible ~ Risk_Preference, data = .)summary(fit_possible)confint(fit_possible)# See text for interpretation.fit_should = responsesWideCorrelates %>%select(Risk_Preference, Should) %>%lm(Should ~ Risk_Preference, data = .)summary(fit_should)confint(fit_should)# See text for interpretation.fit_rights = responsesWideCorrelates %>%select(Risk_Preference, Rights) %>%lm(Rights ~ Risk_Preference, data = .)summary(fit_rights)confint(fit_rights)# See text for interpretation.
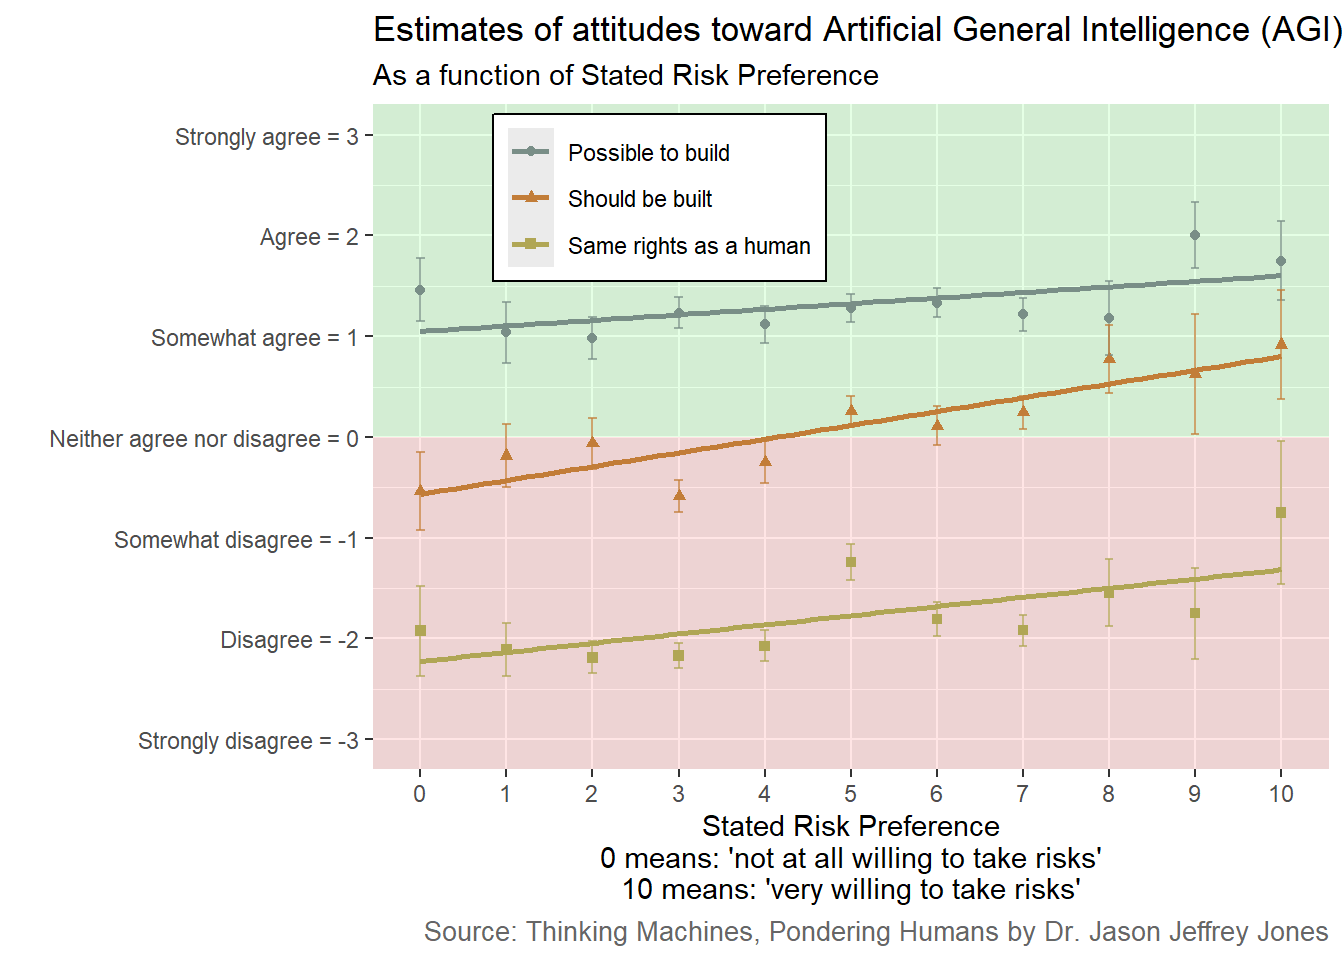
Figure 3.7: Respondents who state they are more willing to take risks more strongly agree that Artificial General Intelligence should be built.
Focus your attention on the orange triangle points and regression line in the center. Here we see how risk-takers and risk-avoiders differ in their agreement with If scientists determine AGI can be built, it should be built.
Those willing to take risks say AGI should be built.
3.5 Democrats and Republicans
It sometimes seems as if Democrats and Republicans disagree about everything. Are AGI attitudes politically polarizing? Let’s find out!
A funny thing about surveying political party affiliation is that many Americans will (at first) claim none. When gently pressed, they will admit a lean towards one party over the other.
Thus, I followed typical survey procedure and asked the following questions to place respondents into political party categories.
In politics today, do you consider yourself a Republican, Democrat, an independent or something else?
(Only those who chose ‘independent’ or ‘something else’ were asked the follow-up):
As of today, do you lean more to the Republican Party or more to the Democratic Party?
In the following analyses, I want to be clear that Republican = Republican + Lean Republican and Democrat = Democratic + Lean Democratic. In surveys generally, results are typically similar for subgroups who chose a party in the first question or ‘leaned’ to the party in the second question. I follow typical procedure here and group them together.
First, let’s just see how many respondents we’re working with in each category.
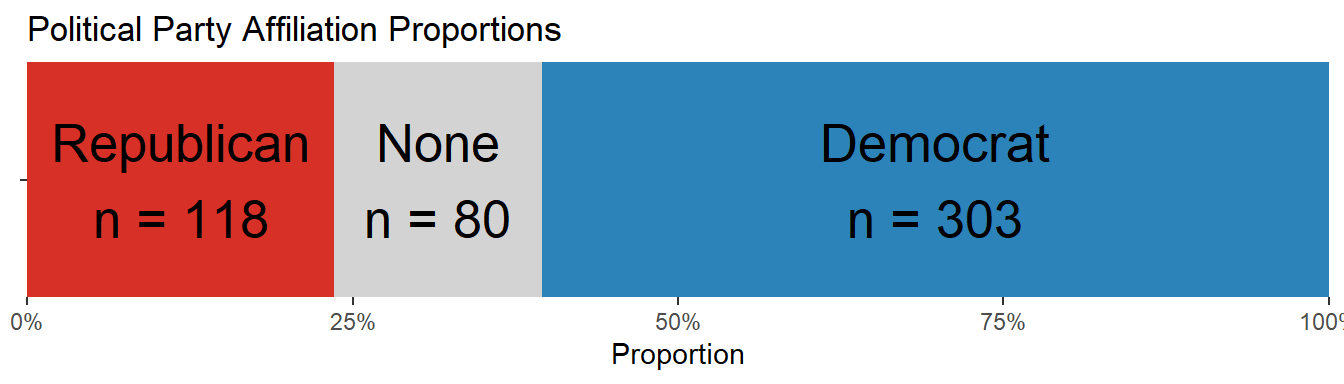
Figure 3.8: More respondents reported a ‘Democrat’ (303) affiliation than ‘Republican’ (118). Some did not choose a party for both questions: None (80)
We see that more of our respondents report a Democrat affiliation (303) than Republican (118).
Now let’s see what difference political party made. (I only included the party affiliation item on the most recent wave of the survey; the following results are for 2024.)
Code
# Pivot longer and add the Short_Prompt column.politicalParty = responsesWideCorrelates %>%select(Party, Possible, Should, Rights) %>%pivot_longer(cols =c("Possible", "Should", "Rights"), names_to ="Short_Prompt", values_to ="Response" ) %>%mutate(Short_Prompt =ifelse(Short_Prompt =="Possible", "Possible to build", Short_Prompt) ) %>%mutate(Short_Prompt =ifelse(Short_Prompt =="Should", "Should be built", Short_Prompt)) %>%mutate(Short_Prompt =ifelse(Short_Prompt =="Rights", "Same rights as a human", Short_Prompt)) %>%mutate(Short_Prompt =factor(Short_Prompt, levels=c("Possible to build", "Should be built", "Same rights as a human"), ordered =FALSE) )# Create a Party figurepoliticalParty %>%group_by(Short_Prompt, Party) %>%summarise(Mean_Response =mean(Response),sd =sd(Response),n =n(),se = sd /sqrt(n),error_low = Mean_Response - se,error_high = Mean_Response + se ) %>%ggplot(aes(x = Party, y = Mean_Response, shape=Party, color=Party, group=Party)) +annotate(geom="rect", xmin=-Inf, xmax=Inf, ymin=0.0, ymax=Inf, fill="green", alpha=0.1) +annotate(geom="rect", xmin=-Inf, xmax=Inf, ymin=-Inf, ymax=0.0, fill="red", alpha=0.1) +geom_pointrange(aes(ymin = error_low, ymax = error_high), linewidth =1 ) +#scale_y_continuous(limits = c(-1.75,1.6), breaks = -1:1, labels = c("Somewhat disagree -1", "Neither agree nor disagree 0", "Somewhat agree 1")) +scale_color_manual(values =c("Democrat"="#2B83BA", "None"="darkgrey", "Republican"="#D73027")) +ggtitle("Estimates of attitudes toward Artificial General Intelligence (AGI)", "Separated by Political Party Affiliation") +xlab("") +ylab("") +theme(legend.position ="none") +facet_wrap(~ Short_Prompt, nrow=1)# For each item, let's estimate the association with Political Party.fit_possible = politicalParty %>%filter(Short_Prompt =="Possible to build") %>%lm(Response ~ Party, data = .)summary(fit_possible)confint(fit_possible)# See text for interpretation.fit_should = politicalParty %>%filter(Short_Prompt =="Should be built") %>%lm(Response ~ Party, data = .)summary(fit_should)confint(fit_should)# See text for interpretation.fit_rights = politicalParty %>%filter(Short_Prompt =="Same rights as a human") %>%lm(Response ~ Party, data = .)summary(fit_rights)confint(fit_rights)# See text for interpretation.
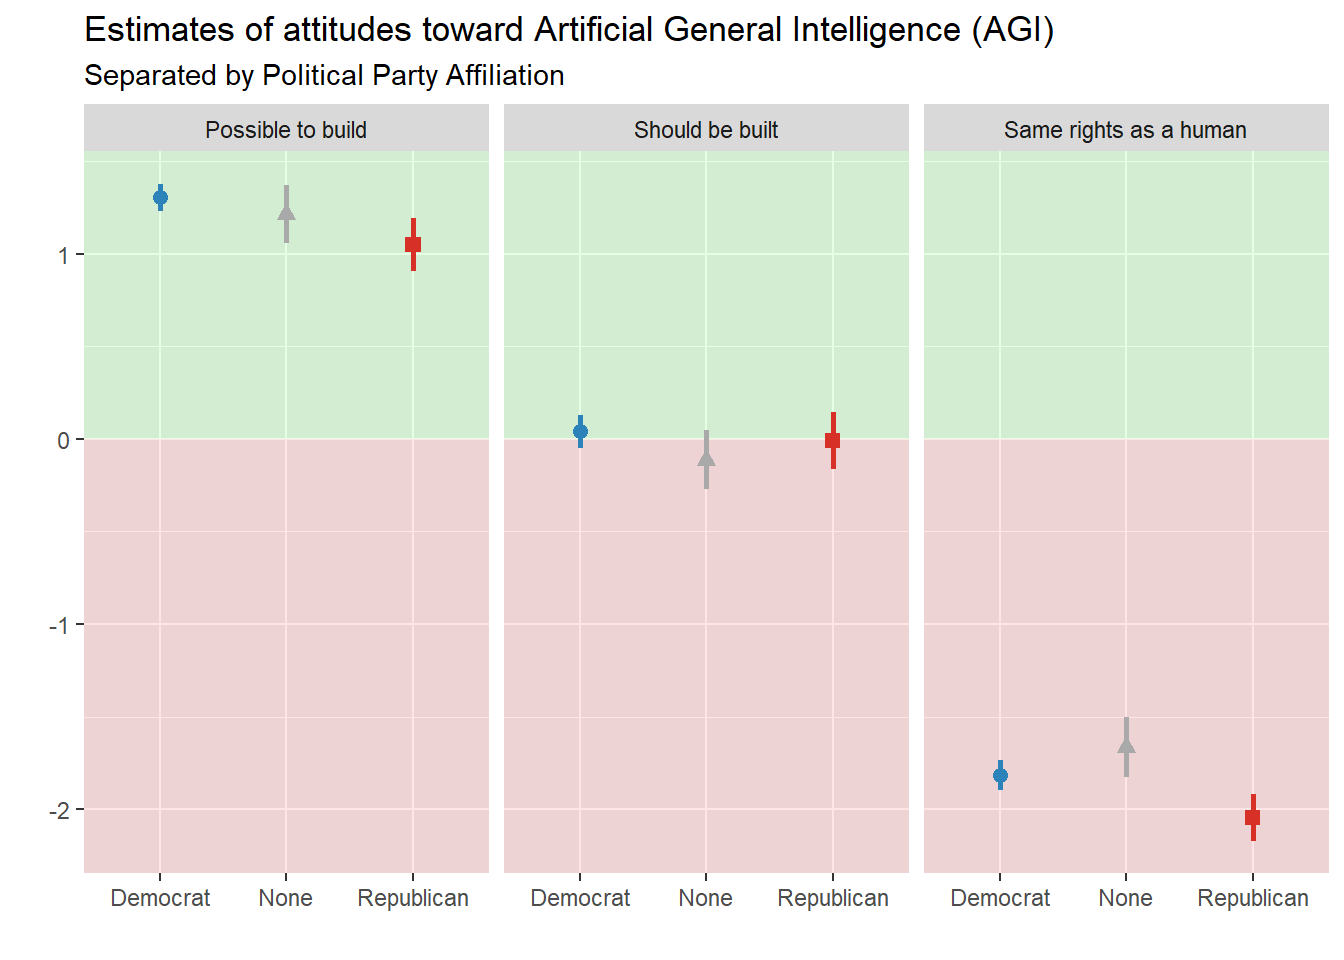
Figure 3.9: Political party affiliation as predictor for AGI attitudes. None of the small differences here reach statistical significance.
In 2024, political party identification did not strongly predict beliefs about and attitudes toward Artificial General Intelligence.
R code for analysis and visualization is embedded above (some formats) or available at TODO GITHUB/ZENODO.
3.8 Summary and What’s Next
Digging deeper into the data, we observe who tends to hold more sanguine attitudes toward AGI. Males, those more willing to take risks and those with more generalized trust in others all agreed more strongly that AGI should be built.