With the introduction of ChatGPT, artificial intelligence entered many Americans’ lives as a conversation partner. Some derided it as a producer of slop or merely a parrot. Others praised its ability to empathize or declared it sentient. This chapter will examine the foundation of those feelings: Did Americans trust AI?
8.1 Analysis, Visualization and Interpretation
Let’s compare Americans’ trust in artificial intelligence to other targets of trust. I ran a survey experiment by varying target of trust within-subject — meaning we can compare each person’s self-reported trust across all targets.
Code
# The file ai-trust-2023-wide-correlates.csv contains responses from a US representative sample of 501 respondents.# Download the file from a public Open Science Framework repository at https://osf.io/download/qpdvb/responses =read_csv("data/ai-trust-2023-wide-correlates.csv")# Colors for the five targets of trust.trust_colors <-c("Congress"="#E41A1C","the President"="#377EB8","artificial intelligence algorithms"="#4DAF4A","the average American"="#984EA3","my best friend"="#FF7F00")# Reshape the trust items and calculate descriptive statistics.visualize_trust_means <- responses %>%select( trust_ai, trust_congress, trust_average_american, trust_us_president, trust_best_friend ) %>%pivot_longer(cols =everything(),names_to ="trust_item",values_to ="Response" ) %>%mutate(prompt_item =recode( trust_item,trust_ai ="artificial intelligence algorithms",trust_congress ="Congress",trust_average_american ="the average American",trust_us_president ="the President",trust_best_friend ="my best friend" ),prompt_item =factor( prompt_item,levels =c("Congress","the President","artificial intelligence algorithms","the average American","my best friend" ) ) ) %>%group_by(prompt_item) %>%summarise(n =sum(!is.na(Response)),mean_response =mean(Response, na.rm =TRUE),standard_deviation =sd(Response, na.rm =TRUE),standard_error = standard_deviation /sqrt(n),critical_value =qt(.975, df = n -1),ci_l = mean_response - critical_value * standard_error,ci_u = mean_response + critical_value * standard_error,.groups ="drop" )book_source_caption =paste0("Source: Thinking Machines, Pondering Humans by Dr. Jason Jeffrey Jones")trust_caption <-paste0("Bars show mean agreement. Error bars show 95% confidence intervals.\n","Responses range from −3 (Strongly disagree) to +3 (Strongly agree).\n", book_source_caption)visualize_trust_means %>%ggplot(aes(x = prompt_item,y = mean_response,color = prompt_item,fill = prompt_item ) ) +geom_col(width =0.75,linewidth =0.4 ) +geom_errorbar(aes(ymin = ci_l,ymax = ci_u ),color ="black",width =0.2 ) +geom_hline(yintercept =0,linewidth =0.5,linetype ="dashed" ) +scale_x_discrete(labels = \(x) stringr::str_wrap(x, width =14) ) +scale_y_continuous(limits =c(-3, 3),breaks =-3:3,labels =c("−3\nStrongly\ndisagree","−2","−1","0\nNeither","+1","+2","+3\nStrongly\nagree" ),expand =expansion(mult =c(0, 0.03)) ) +scale_color_manual(values = trust_colors) +scale_fill_manual(values = trust_colors) +labs(title ="Trust in artificial intelligence and other targets",subtitle ="Agreement with “I trust <target> to do the right thing.”",x =NULL,y ="Mean response",caption = trust_caption ) +coord_flip() +theme_minimal(base_size =12) +theme(legend.position ="none",panel.grid.major.y =element_blank(),panel.grid.minor =element_blank(),plot.caption =element_text(size =10,color ="#666666",hjust =1 ) )
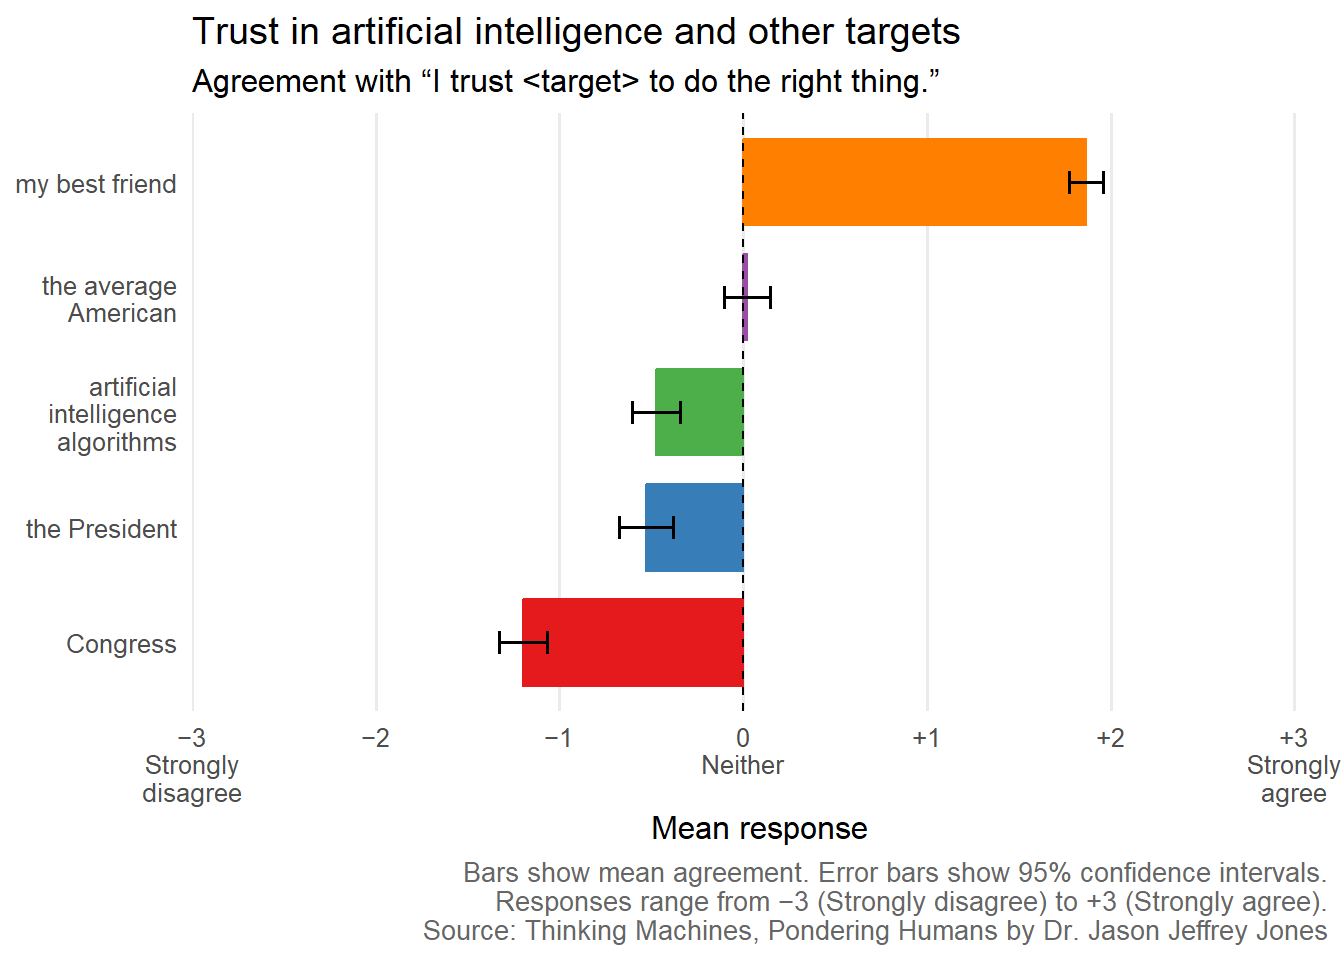
Figure 8.1: Mean trust across five targets in the 2023 survey experiment. Respondents indicated their agreement with the statement, “I trust <target> to do the right thing.” Error bars show 95% confidence intervals.
On average, Americans neither agreed nor disagreed that they trusted the average American to do the right thing. On average, they trusted their best friends much more.
Below the zero line were artificial intelligence and politicians. Congress (the 118th) was most distrusted. Americans’ wariness toward artificial intelligence matched that toward The President (Biden).
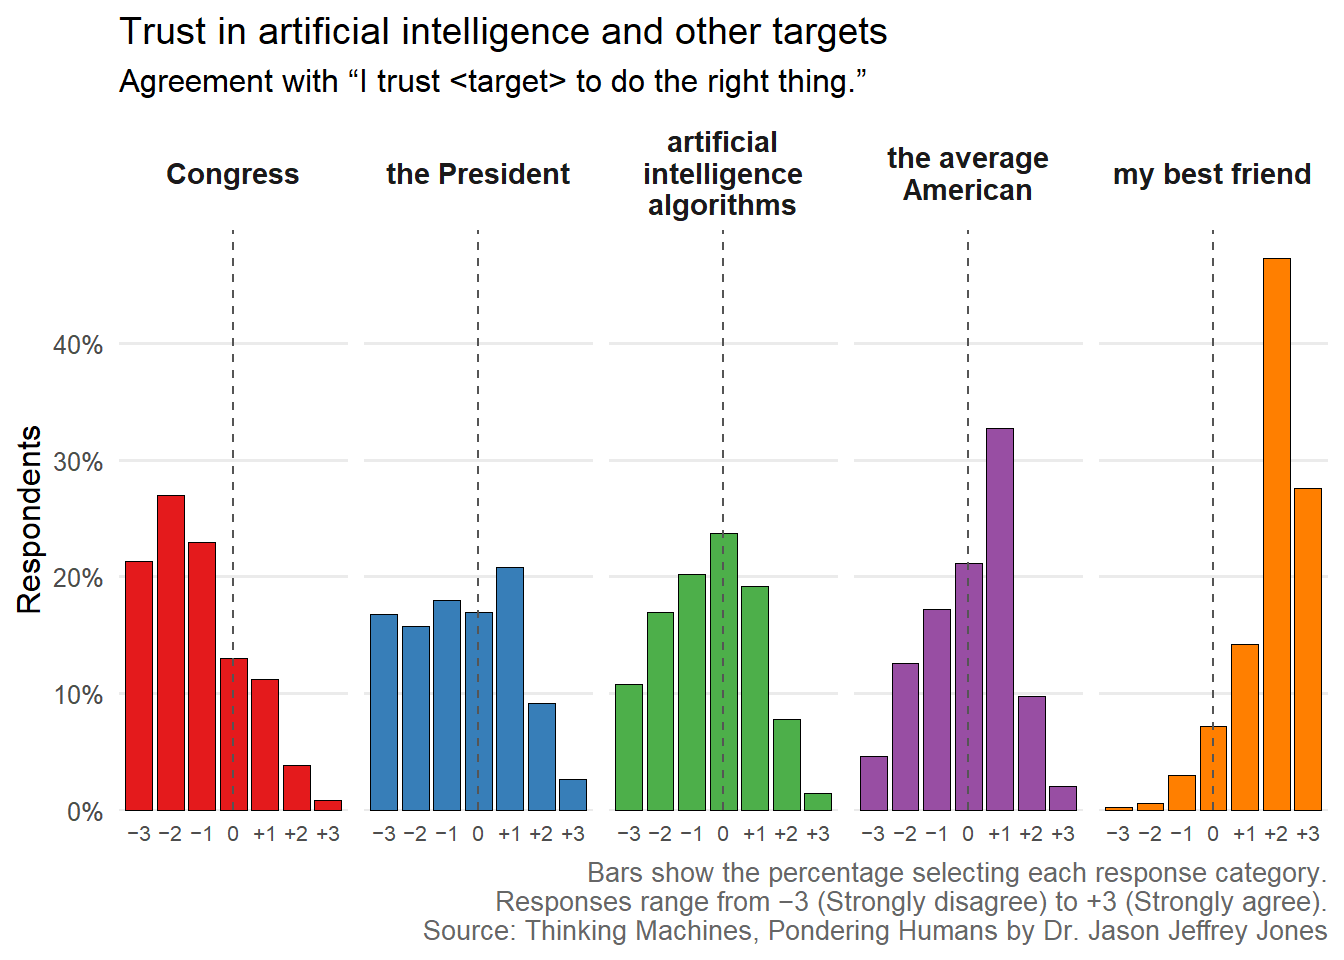
I have worked with this survey experiment format before, and I know it is useful to disaggregate. Below are the full distributions.
Code
# Reshape the five trust items from one column per item to one row# per respondent-target combination.trust_long_2023 <- responses %>%select( trust_ai, trust_congress, trust_average_american, trust_us_president, trust_best_friend ) %>%pivot_longer(cols =everything(),names_to ="trust_item",values_to ="Response" ) %>%mutate(prompt_item =recode( trust_item,trust_ai ="artificial intelligence algorithms",trust_congress ="Congress",trust_average_american ="the average American",trust_us_president ="the President",trust_best_friend ="my best friend" ),prompt_item =factor( prompt_item,levels =c("Congress","the President","artificial intelligence algorithms","the average American","my best friend" ) ) )# Calculate the percentage selecting each response for each target.## complete() retains all seven response categories, even if a category# received no responses for a particular target.visualize_trust_distributions <- trust_long_2023 %>%filter(!is.na(Response)) %>%count(prompt_item, Response, name ="n") %>%group_by(prompt_item) %>%complete(Response =-3:3,fill =list(n =0) ) %>%mutate(percent = n /sum(n) ) %>%ungroup()trust_distribution_caption <-paste0("Bars show the percentage selecting each response category.\n","Responses range from −3 (Strongly disagree) to +3 (Strongly agree).\n", book_source_caption)visualize_trust_distributions %>%ggplot(aes(x = Response,y = percent,fill = prompt_item ) ) +geom_col(width =0.85,color ="black",linewidth =0.3 ) +geom_vline(xintercept =0,linetype ="dashed",linewidth =0.4,color ="#555555" ) +facet_wrap(vars(prompt_item),nrow =1,labeller =label_wrap_gen(width =16) ) +scale_x_continuous(breaks =-3:3,minor_breaks =NULL,labels =c("−3","−2","−1","0","+1","+2","+3" ),expand =expansion(mult =c(0.03, 0.03)) ) +scale_y_continuous(labels = scales::label_percent(accuracy =1),breaks = scales::breaks_width(0.1),minor_breaks =NULL,expand =expansion(mult =c(0, 0.05)) ) +scale_fill_manual(values = trust_colors) +labs(title ="Trust in artificial intelligence and other targets",subtitle ="Agreement with “I trust <target> to do the right thing.”",x =NULL,y ="Respondents",caption = trust_distribution_caption ) +theme_minimal(base_size =12) +theme(legend.position ="none",panel.grid.major.x =element_blank(),panel.grid.minor =element_blank(),strip.text =element_text(size =11,face ="bold" ),axis.text.x =element_text(size =8),plot.caption =element_text(size =10,color ="#666666",hjust =1 ) )
Figure 8.2: Full distributions of trust across five targets in the 2023 survey experiment. Respondents indicated their agreement with the statement, “I trust <target> to do the right thing.”
Here one can inspect subtleties. No matter the target, respondents shied away from strong agreement. The President and the average american had modal, modestly positive trust (+1). By contrast, the most frequent response was to neither trust nor distrust artificial intelligence algorithms.
8.1.1 What predicted trust in artificial intelligence?
We can see in Figure 8.2 that American adults were distributed among different levels of trust in AI. Who trusted and who distrusted? Let’s step through cycles of (1) hypothesis (2) test (3) evaluate.
These analyses aim to predict trust in AI. We’ll use the other observations about each respondent as predictors.
8.1.1.1 Model 1: Demographic baseline
One has to start somewhere, so let’s begin with available demographics: Sex and Age. Respondents reported their Sex as Female or Male, and this split the sample roughly in half. Age varied from 19 to 80.
How much would knowing a respondents’ Sex and Age tell you about their trust in AI?
Code
# Create one common analysis sample for all nested models.analysis_sample <- responses %>%drop_na( trust_ai, Age, Sex, generalized_trust, risk_self_report, understanding_algorithmic_bias, understanding_ai, understanding_large_language_models, understanding_convolutional_neural_networks, trust_congress, trust_us_president, trust_average_american, trust_best_friend )# Prepare the variables for Model 1.model_1_data <- analysis_sample %>%transmute( trust_ai,age_decades_centered = (Age -mean(Age, na.rm =TRUE)) /10,Sex =factor( Sex,levels =c("Female", "Male") ) ) %>%drop_na()# Fit Model 1: demographic characteristics.model_1_demographics <-lm( trust_ai ~ age_decades_centered + Sex,data = model_1_data)# Coefficients, confidence intervals, and model-level statistics.model_1_coefficients <- broom::tidy( model_1_demographics,conf.int =TRUE)model_1_fit <- broom::glance(model_1_demographics)model_1_coefficients %>%mutate(term =recode( term,`(Intercept)`="Intercept: average-age woman",age_decades_centered ="Age: 10-year increase",SexMale ="Men compared with women" ) ) %>%select(Predictor = term,Estimate = estimate,`Standard error`= std.error,`95% CI lower`= conf.low,`95% CI upper`= conf.high,`p-value`= p.value ) %>%mutate(across(where(is.numeric), \(x) round(x, 3) ) ) %>% knitr::kable(caption ="Model 1: Demographic predictors of trust in artificial intelligence." )
Model 1: Demographic predictors of trust in artificial intelligence.
Broadly, men and women differed, but young and old did not.
Age and sex explained only a small portion of the differences in trust in artificial intelligence, (R^2 = .017), adjusted (R^2 = .013), although the demographic model as a whole was statistically distinguishable from an intercept-only model, (F(2,497)=4.36), (p=.013).
Among women of approximately the sample’s average age, 45.7 years, predicted trust in AI was −0.66 on the scale from −3 to +3. Men reported trust scores 0.39 points higher than women, 95% CI [0.13, 0.66], (p=.003). Age contributed essentially no additional information: a ten-year increase in age was associated with a change of only −0.004 points, 95% CI [−0.09, 0.08], (p=.920). Thus, the demographic difference was primarily a difference between men and women, but age and sex together accounted for less than 2% of the observed variation in AI trust.
Overall, demographics provided some information: you can use Sex and Age to do better than just guess the mean for everyone.
8.1.1.2 Model 2: General personal dispositions
Individuals differ in how trusting they are and how much they prefer safety to risk. These are our next candidates for predictors: generalized trust and general willingness to take risks. I borrow existing survey items to measure each, which I have discussed more fully in Section 3.3.
Code
# Prepare variables for Model 2 using the same analysis sample# used for Model 1.model_2_data <- analysis_sample %>%transmute( trust_ai,age_decades_centered = (Age -mean(Age)) /10,Sex =factor( Sex,levels =c("Female", "Male") ),generalized_trust =factor( generalized_trust,levels =c("Careful", "Trusting") ),# Rename the raw survey variable using the terminology# adopted in this chapter.risk_willingness = risk_self_report,# Center at the sample mean while retaining the original# one-point unit of measurement.risk_willingness_centered = risk_willingness -mean(risk_willingness) )# Fit Model 2.model_2_dispositions <-lm( trust_ai ~ age_decades_centered + Sex + generalized_trust + risk_willingness_centered,data = model_2_data)# Extract Model 2 coefficients and confidence intervals.model_2_coefficients <- broom::tidy( model_2_dispositions,conf.int =TRUE)model_2_fit <- broom::glance( model_2_dispositions)# Display the coefficients.model_2_coefficients %>%mutate(term =recode( term,`(Intercept)`=paste("Intercept: average-age, average-risk woman","in the Careful group" ),age_decades_centered ="Age: 10-year increase",SexMale ="Men compared with women",generalized_trustTrusting ="Trusting compared with Careful",risk_willingness_centered ="Willingness to take risks: one-point increase" ) ) %>%select(Predictor = term,Estimate = estimate,`Standard error`= std.error,`95% CI lower`= conf.low,`95% CI upper`= conf.high,`p-value`= p.value ) %>%mutate(across(where(is.numeric), \(x) round(x, 3) ) ) %>% knitr::kable(caption =paste("Model 2: Demographics, generalized trust, and","willingness to take risks as predictors of trust","in artificial intelligence." ) )
Model 2: Demographics, generalized trust, and willingness to take risks as predictors of trust in artificial intelligence.
Predictor
Estimate
Standard error
95% CI lower
95% CI upper
p-value
Intercept: average-age, average-risk woman in the Careful group
-0.739
0.106
-0.948
-0.530
0.000
Age: 10-year increase
-0.005
0.042
-0.087
0.077
0.908
Men compared with women
0.305
0.134
0.043
0.568
0.023
Trusting compared with Careful
0.285
0.135
0.019
0.550
0.036
Willingness to take risks: one-point increase
0.105
0.031
0.045
0.164
0.001
Code
# Compare the fit of Models 1 and 2.model_fit_comparison <-tibble(Model =c("Model 1: Demographics","Model 2: General personal dispositions" ),N =c( model_1_fit$nobs, model_2_fit$nobs ),`R²`=c( model_1_fit$r.squared, model_2_fit$r.squared ),`Adjusted R²`=c( model_1_fit$adj.r.squared, model_2_fit$adj.r.squared ),`Change in R²`=c(NA_real_, model_2_fit$r.squared - model_1_fit$r.squared ))model_fit_comparison %>%mutate(across(where(is.numeric), \(x) round(x, 3) ) ) %>% knitr::kable(caption ="Model fit before and after adding general personal dispositions." )
Model fit before and after adding general personal dispositions.
Model
N
R²
Adjusted R²
Change in R²
Model 1: Demographics
500
0.017
0.013
NA
Model 2: General personal dispositions
500
0.048
0.040
0.031
Code
# Test whether generalized trust and willingness to take risks# improve the model as a block.model_2_block_test <-anova( model_1_demographics, model_2_dispositions)model_2_block_test %>% broom::tidy() %>%slice(2) %>%transmute(Comparison ="Model 1 versus Model 2",`Added parameters`= df,`Residual df`= df.residual,F = statistic,`p-value`= p.value ) %>%mutate(across(where(is.numeric), \(x) round(x, 3) ) ) %>% knitr::kable(caption =paste("Nested-model test for generalized trust and","willingness to take risks." ) )
Nested-model test for generalized trust and willingness to take risks.
Comparison
Added parameters
Residual df
F
p-value
Model 1 versus Model 2
2
495
7.96
0
This second approach did a better job of predicting trust in AI. Trusting individuals and those more willing to take risks trusted AI more.
Adding generalized trust and general willingness to take risks improved the model beyond age and sex, (F(2,495)=7.96), (p<.001). The proportion of variation accounted for increased from (R^2=.017) to (R^2=.048), a gain of 3.1 percentage points; the adjusted (R^2) for Model 2 was .040.
In this model, the intercept describes an average-age woman with average willingness to take risks who said that one cannot be too careful in dealing with people. Her predicted score was −0.74 on the scale. Respondents who instead said that most people can generally be trusted scored 0.29 points higher in AI trust, 95% CI [0.02, 0.55], (p=.036). Each one-point increase in willingness to take risks was associated with a 0.11-point increase in AI trust, 95% CI [0.05, 0.16], (p<.001). The estimated difference between men and women decreased from 0.39 to 0.31 points after adding the two dispositions, but remained statistically reliable, (p=.023); age remained unrelated to AI trust.
Generalized trust and willingness to take risks therefore provided additional information, although the model still left more than 95% of the individual variation in AI trust unaccounted for.
8.1.1.3 Model 3: Perceived understanding of AI
Imagine a person you are deeply familiar with. You may trust them a lot, because you know them well. But that does not necessarily follow. It is absolutely possible to distrust someone you know very well, because you know their ineptness, unreliability and other shortcomings.
Did American adults who knew AI well trust it more or less? We will use their reported understanding of AI related concepts as a proxy and examine that question next.
Code
# Prepare variables for Model 3 using the common analysis sample.model_3_data <- analysis_sample %>%transmute( trust_ai,age_decades_centered = (Age -mean(Age)) /10,Sex =factor( Sex,levels =c("Female", "Male") ),generalized_trust =factor( generalized_trust,levels =c("Careful", "Trusting") ),risk_willingness = risk_self_report,risk_willingness_centered = risk_willingness -mean(risk_willingness), understanding_ai, understanding_algorithmic_bias, understanding_large_language_models, understanding_convolutional_neural_networks )# Fit Model 3 by adding self-reported understanding# of AI-related concepts.model_3_understanding <-lm( trust_ai ~ age_decades_centered + Sex + generalized_trust + risk_willingness_centered + understanding_ai + understanding_algorithmic_bias + understanding_large_language_models + understanding_convolutional_neural_networks,data = model_3_data)# Extract Model 3 coefficients and confidence intervals.model_3_coefficients <- broom::tidy( model_3_understanding,conf.int =TRUE)model_3_fit <- broom::glance( model_3_understanding)# Display the coefficients.model_3_coefficients %>%mutate(term =recode( term,`(Intercept)`=paste("Intercept: average-age, average-risk woman","in the Careful group with neutral understanding responses" ),age_decades_centered ="Age: 10-year increase",SexMale ="Men compared with women",generalized_trustTrusting ="Trusting compared with Careful",risk_willingness_centered ="Willingness to take risks: one-point increase",understanding_ai ="Understanding artificial intelligence",understanding_algorithmic_bias ="Understanding algorithmic bias",understanding_large_language_models ="Understanding large language models",understanding_convolutional_neural_networks ="Understanding convolutional neural networks" ) ) %>%select(Predictor = term,Estimate = estimate,`Standard error`= std.error,`95% CI lower`= conf.low,`95% CI upper`= conf.high,`p-value`= p.value ) %>%mutate(across(where(is.numeric), \(x) round(x, 3) ) ) %>% knitr::kable(caption =paste("Model 3: Demographics, general personal dispositions,","and self-reported understanding as predictors of trust","in artificial intelligence." ) )
Model 3: Demographics, general personal dispositions, and self-reported understanding as predictors of trust in artificial intelligence.
Predictor
Estimate
Standard error
95% CI lower
95% CI upper
p-value
Intercept: average-age, average-risk woman in the Careful group with neutral understanding responses
-0.496
0.145
-0.782
-0.211
0.001
Age: 10-year increase
0.004
0.042
-0.078
0.086
0.928
Men compared with women
0.259
0.132
0.000
0.518
0.050
Trusting compared with Careful
0.347
0.132
0.087
0.607
0.009
Willingness to take risks: one-point increase
0.072
0.031
0.012
0.132
0.020
Understanding artificial intelligence
0.224
0.061
0.104
0.344
0.000
Understanding algorithmic bias
-0.167
0.057
-0.279
-0.055
0.003
Understanding large language models
0.082
0.067
-0.050
0.213
0.223
Understanding convolutional neural networks
0.091
0.067
-0.041
0.222
0.176
Code
# Compare model fit across Models 1 through 3.model_fit_comparison <-tibble(Model =c("Model 1: Demographics","Model 2: General personal dispositions","Model 3: Self-reported understanding" ),N =c( model_1_fit$nobs, model_2_fit$nobs, model_3_fit$nobs ),`R²`=c( model_1_fit$r.squared, model_2_fit$r.squared, model_3_fit$r.squared ),`Adjusted R²`=c( model_1_fit$adj.r.squared, model_2_fit$adj.r.squared, model_3_fit$adj.r.squared ),`Change in R²`=c(NA_real_, model_2_fit$r.squared - model_1_fit$r.squared, model_3_fit$r.squared - model_2_fit$r.squared ))model_fit_comparison %>%mutate(across(where(is.numeric), \(x) round(x, 3) ) ) %>% knitr::kable(caption =paste("Model fit before and after adding","self-reported understanding." ) )
Model fit before and after adding self-reported understanding.
Model
N
R²
Adjusted R²
Change in R²
Model 1: Demographics
500
0.017
0.013
NA
Model 2: General personal dispositions
500
0.048
0.040
0.031
Model 3: Self-reported understanding
500
0.106
0.091
0.058
Code
# Test whether the four understanding items improve# the model as a block.model_3_block_test <-anova( model_2_dispositions, model_3_understanding)model_3_block_test %>%as.data.frame() %>%slice(2) %>%transmute(Comparison ="Model 2 versus Model 3",`Added parameters`= Df,`Residual df`= Res.Df,F = F,`p-value`=`Pr(>F)` ) %>%mutate(across(where(is.numeric), \(x) round(x, 3) ) ) %>% knitr::kable(caption =paste("Nested-model test for the block of","self-reported understanding items." ) )
Nested-model test for the block of self-reported understanding items.
Comparison
Added parameters
Residual df
F
p-value
2
Model 2 versus Model 3
4
491
7.913
0
Adding respondents’ self-reported understanding of four AI-related concepts substantially improved the model, (F(4,491)=7.91), (p<.001). The proportion of variation accounted for increased from (R^2=.048) in Model 2 to (R^2=.106) in Model 3, a gain of 5.8 percentage points; the adjusted (R^2) for the full model was .091.
Holding the other predictors constant, each one-point increase in reported understanding of artificial intelligence was associated with a 0.22-point increase in trust in AI, 95% CI [0.10, 0.34], (p<.001). In contrast, greater reported understanding of algorithmic bias was associated with 0.17 points less trust, 95% CI [−0.28, −0.06], (p=.003). Reported understanding of large language models and convolutional neural networks had positive but statistically unreliable coefficients. Generalized trust and willingness to take risks remained associated with AI trust, while the estimated difference between men and women decreased to 0.26 points and was no longer clearly distinguishable from zero, (p=.050). Age again contributed essentially no information.
Overall, perceived understanding added meaningful predictive information. More familiarity with AI was associated with more trust, with the interesting exception of algorithmic bias.
8.1.1.4 Model 4: Wider trust profile
Individuals trusted AI more if they reported higher generalized trust. That implies that Americans who trust the average American should also trust AI more. Could that be true? Let’s find out if trust levels correlated, and thus each person’s profile of trust predicted their AI trust.
Code
# Prepare variables for Model 4 using the common analysis sample.model_4_data <- analysis_sample %>%transmute( trust_ai,age_decades_centered = (Age -mean(Age)) /10,Sex =factor( Sex,levels =c("Female", "Male") ),generalized_trust =factor( generalized_trust,levels =c("Careful", "Trusting") ),risk_willingness = risk_self_report,risk_willingness_centered = risk_willingness -mean(risk_willingness), understanding_ai, understanding_algorithmic_bias, understanding_large_language_models, understanding_convolutional_neural_networks, trust_congress, trust_us_president, trust_average_american, trust_best_friend )# Fit Model 4 by adding respondents' trust in the other four targets.model_4_wider_trust <-lm( trust_ai ~ age_decades_centered + Sex + generalized_trust + risk_willingness_centered + understanding_ai + understanding_algorithmic_bias + understanding_large_language_models + understanding_convolutional_neural_networks + trust_congress + trust_us_president + trust_average_american + trust_best_friend,data = model_4_data)# Extract Model 4 coefficients and model-fit statistics.model_4_coefficients <- broom::tidy( model_4_wider_trust,conf.int =TRUE)model_4_fit <- broom::glance( model_4_wider_trust)# Display the coefficients.model_4_coefficients %>%mutate(term =recode( term,`(Intercept)`=paste("Intercept: average-age, average-risk woman in the Careful","group with neutral understanding and trust responses" ),age_decades_centered ="Age: 10-year increase",SexMale ="Men compared with women",generalized_trustTrusting ="Trusting compared with Careful",risk_willingness_centered ="Willingness to take risks: one-point increase",understanding_ai ="Understanding artificial intelligence",understanding_algorithmic_bias ="Understanding algorithmic bias",understanding_large_language_models ="Understanding large language models",understanding_convolutional_neural_networks ="Understanding convolutional neural networks",trust_congress ="Trust in Congress",trust_us_president ="Trust in the President",trust_average_american ="Trust in the average American",trust_best_friend ="Trust in my best friend" ) ) %>%select(Predictor = term,Estimate = estimate,`Standard error`= std.error,`95% CI lower`= conf.low,`95% CI upper`= conf.high,`p-value`= p.value ) %>%mutate(across(where(is.numeric), \(x) round(x, 3) ) ) %>% knitr::kable(caption =paste("Model 4: Demographics, general personal dispositions,","self-reported understanding, and trust in other targets","as predictors of trust in artificial intelligence." ) )
Model 4: Demographics, general personal dispositions, self-reported understanding, and trust in other targets as predictors of trust in artificial intelligence.
Predictor
Estimate
Standard error
95% CI lower
95% CI upper
p-value
Intercept: average-age, average-risk woman in the Careful group with neutral understanding and trust responses
-0.196
0.162
-0.515
0.122
0.227
Age: 10-year increase
-0.072
0.038
-0.147
0.004
0.062
Men compared with women
0.300
0.117
0.070
0.531
0.011
Trusting compared with Careful
-0.180
0.133
-0.441
0.081
0.175
Willingness to take risks: one-point increase
0.041
0.027
-0.013
0.095
0.134
Understanding artificial intelligence
0.172
0.054
0.065
0.279
0.002
Understanding algorithmic bias
-0.136
0.051
-0.236
-0.035
0.008
Understanding large language models
0.064
0.059
-0.052
0.181
0.280
Understanding convolutional neural networks
0.025
0.061
-0.095
0.144
0.681
Trust in Congress
0.258
0.054
0.152
0.365
0.000
Trust in the President
0.162
0.044
0.074
0.249
0.000
Trust in the average American
0.150
0.053
0.045
0.254
0.005
Trust in my best friend
0.081
0.059
-0.035
0.198
0.171
Code
# Compare model fit across Models 1 through 4.model_fit_comparison <-tibble(Model =c("Model 1: Demographics","Model 2: General personal dispositions","Model 3: Self-reported understanding","Model 4: Wider trust profile" ),N =c( model_1_fit$nobs, model_2_fit$nobs, model_3_fit$nobs, model_4_fit$nobs ),`R²`=c( model_1_fit$r.squared, model_2_fit$r.squared, model_3_fit$r.squared, model_4_fit$r.squared ),`Adjusted R²`=c( model_1_fit$adj.r.squared, model_2_fit$adj.r.squared, model_3_fit$adj.r.squared, model_4_fit$adj.r.squared ),`Change in R²`=c(NA_real_, model_2_fit$r.squared - model_1_fit$r.squared, model_3_fit$r.squared - model_2_fit$r.squared, model_4_fit$r.squared - model_3_fit$r.squared ))model_fit_comparison %>%mutate(across(where(is.numeric), \(x) round(x, 3) ) ) %>% knitr::kable(caption =paste("Model fit before and after adding respondents'","wider trust profiles." ) )
Model fit before and after adding respondents’ wider trust profiles.
Model
N
R²
Adjusted R²
Change in R²
Model 1: Demographics
500
0.017
0.013
NA
Model 2: General personal dispositions
500
0.048
0.040
0.031
Model 3: Self-reported understanding
500
0.106
0.091
0.058
Model 4: Wider trust profile
500
0.301
0.284
0.196
Code
# Test whether trust in the other four targets improves# the model as a block.model_4_block_test <-anova( model_3_understanding, model_4_wider_trust)model_4_block_test %>%as.data.frame() %>%slice(2) %>%transmute(Comparison ="Model 3 versus Model 4",`Added parameters`= Df,`Residual df`= Res.Df,F = F,`p-value`=`Pr(>F)` ) %>%mutate(across(where(is.numeric), \(x) round(x, 3) ) ) %>% knitr::kable(caption =paste("Nested-model test for trust in Congress, the President,","the average American, and respondents' best friends." ) )
Nested-model test for trust in Congress, the President, the average American, and respondents’ best friends.
Comparison
Added parameters
Residual df
F
p-value
2
Model 3 versus Model 4
4
487
34.109
0
Individual trust profiles were useful predictors. Interestingly, they competed with and subsumed the binary Trusting/Careful generalized trust variable.
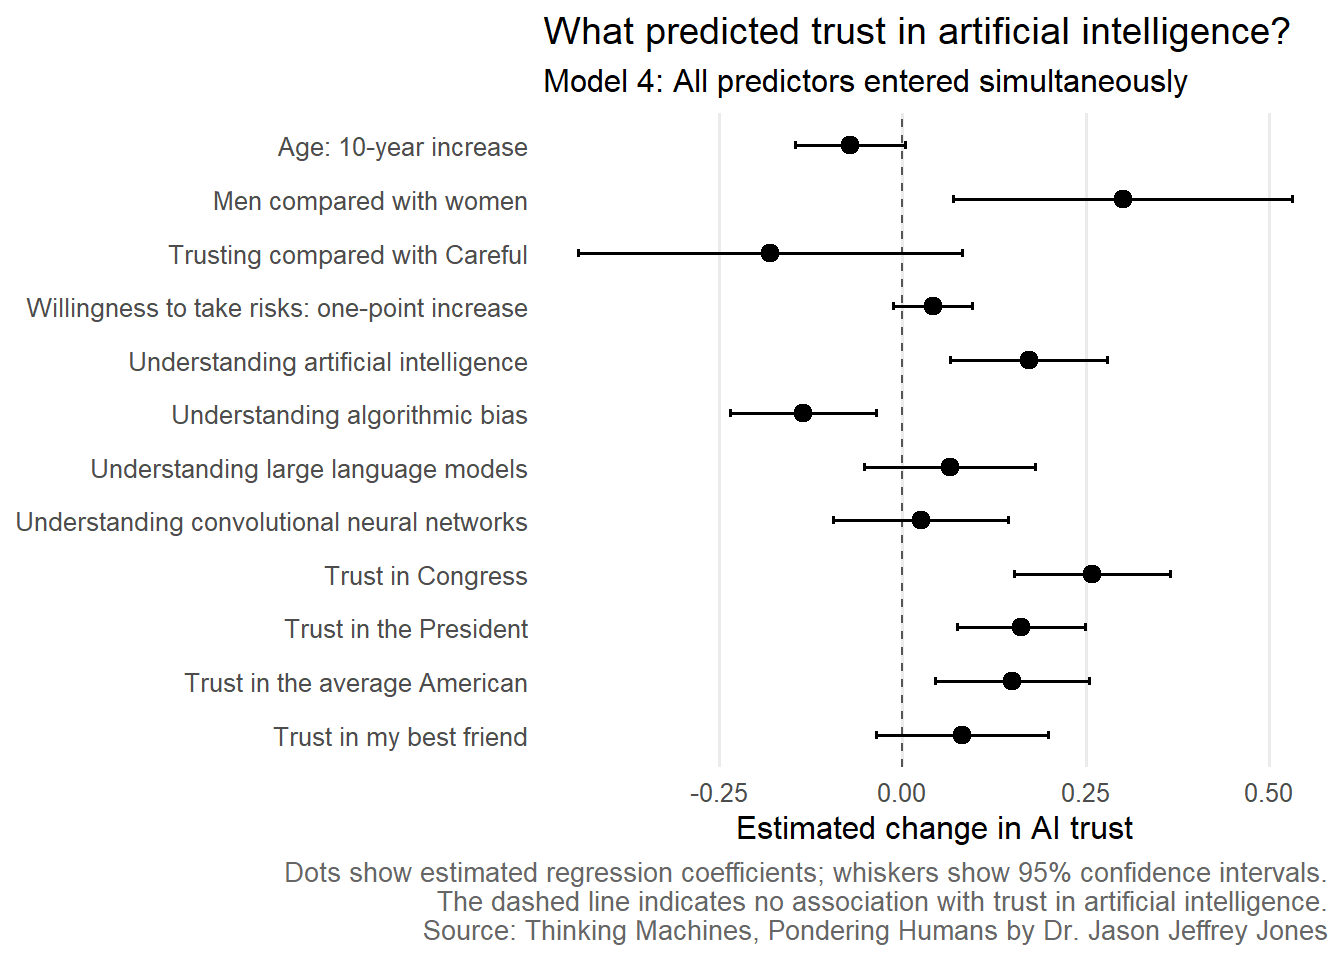
Adding respondents’ trust in the four other targets produced the largest improvement in the nested-model sequence, (F(4,487)=34.11), (p<.001). The proportion of variation accounted for increased from (R^2=.106) in Model 3 to (R^2=.301) in Model 4, a gain of 19.6 percentage points; the adjusted (R^2) for the full model was .284.
Holding the other measured characteristics constant, each one-point increase in trust in Congress was associated with a 0.26-point increase in trust in artificial intelligence, 95% CI [0.15, 0.36], (p<.001). Trust in the President and trust in the average American were also associated with AI trust, with coefficients of 0.16 and 0.15, respectively. Trust in one’s best friend was positively associated with AI trust, but its estimate was smaller and statistically uncertain.
The addition of these closely matched trust items changed the earlier results in revealing ways. Generalized trust, previously a positive predictor, no longer contributed independent information and its coefficient reversed direction, (b=-0.18), (p=.175). Willingness to take risks also became smaller and statistically uncertain, (b=0.04), (p=.134). In contrast, self-reported understanding of artificial intelligence remained positively associated with AI trust, (b=0.17), (p=.002), while understanding of algorithmic bias remained negatively associated with it, (b=-0.14), (p=.008). Men reported approximately 0.30 points more trust in AI than women after adjustment, (p=.011).
Overall, trust in AI was strongly embedded in respondents’ wider trust profiles, but perceived understanding of AI and algorithmic bias continued to distinguish AI trust from a general tendency to trust other targets.
Figure 8.3 below visualizes the influence of each predictor variable.
Code
# Prepare coefficients from the final model for visualization.visualize_model_4_coefficients <- broom::tidy( model_4_wider_trust,conf.int =TRUE) %>%filter(term !="(Intercept)") %>%mutate(Predictor =recode( term,age_decades_centered ="Age: 10-year increase",SexMale ="Men compared with women",generalized_trustTrusting ="Trusting compared with Careful",risk_willingness_centered ="Willingness to take risks: one-point increase",understanding_ai ="Understanding artificial intelligence",understanding_algorithmic_bias ="Understanding algorithmic bias",understanding_large_language_models ="Understanding large language models",understanding_convolutional_neural_networks ="Understanding convolutional neural networks",trust_congress ="Trust in Congress",trust_us_president ="Trust in the President",trust_average_american ="Trust in the average American",trust_best_friend ="Trust in my best friend" ),Block =case_when( term %in%c("age_decades_centered","SexMale" ) ~"Demographics", term %in%c("generalized_trustTrusting","risk_willingness_centered" ) ~"General personal dispositions", term %in%c("understanding_ai","understanding_algorithmic_bias","understanding_large_language_models","understanding_convolutional_neural_networks" ) ~"Self-reported understanding", term %in%c("trust_congress","trust_us_president","trust_average_american","trust_best_friend" ) ~"Wider trust profile" ),Predictor =factor( Predictor,levels =rev(c("Age: 10-year increase","Men compared with women","Trusting compared with Careful","Willingness to take risks: one-point increase","Understanding artificial intelligence","Understanding algorithmic bias","Understanding large language models","Understanding convolutional neural networks","Trust in Congress","Trust in the President","Trust in the average American","Trust in my best friend" )) ) )model_4_caption <-paste0("Dots show estimated regression coefficients; whiskers show 95% confidence intervals.\n","The dashed line indicates no association with trust in artificial intelligence.\n", book_source_caption)visualize_model_4_coefficients %>%ggplot(aes(x = estimate,y = Predictor ) ) +geom_vline(xintercept =0,linetype ="dashed",linewidth =0.5,color ="#555555" ) +geom_errorbar(aes(xmin = conf.low,xmax = conf.high ),orientation ="y",width =0.15,linewidth =0.7 ) +geom_point(size =2.8 ) +labs(title ="What predicted trust in artificial intelligence?",subtitle ="Model 4: All predictors entered simultaneously",x ="Estimated change in AI trust",y =NULL,caption = model_4_caption ) +theme_minimal(base_size =12) +theme(panel.grid.major.y =element_blank(),panel.grid.minor =element_blank(),plot.caption =element_text(size =10,color ="#666666",hjust =1 ) )
Figure 8.3: Predictors of trust in artificial intelligence in Model 4. Dots show estimated regression coefficients and whiskers show 95% confidence intervals.
Coefficient estimates are readable to me and my fellow social scientists, but these results might become clearer if I translate into two characters. (One could argue, caricatures.)
Robert was an older, male American in 2023 who trusted President Biden, other Americans and Congress. He felt he understood artificial intelligence better than most. He was a bit of a risk-taker. Robert trusted artificial intelligence to do the right thing.
Susan did not trust artificial intelligence to do the right thing. She was female, younger and preferred safety over risk-taking. She did not trust the government or her fellow Americans. She was more informed about algorithmic bias than most.
These characteristics placed Robert and Susan on opposite sides of the question: Do you trust AI to do the right thing?
8.1.2 Opposition and Support for AI Development
Respondents to my surveys were American adults, and one thing American adults do is vote. Therefore, it was worth asking — beyond the level of trust they place in AI — how much they oppose or support development of AI. We’ll next examine 2023 responses for this item:
How much do you oppose or support the development of Artificial Intelligence?
I was so interested in this metric that I moved to a daily survey and continued tracking Americans’ AI Support for several years. See Chapter 10 within this book for analysis and visualization. For up-to-date ups and downs from day to day see Jason Jeffrey Jones Productions’ AI Daily Dashboard.
Let’s move straight to a full prediction model. We’ll use all the predictors from Model 4 above, but instead predict AI Support. I’ll show you the results in a table first, then the same information in a visualization.
Code
# Create a complete-case sample for predicting AI support.# This is separate from the trust-model analysis sample so that# missingness in oppose_or_support does not alter Models 1 through 4.support_analysis_sample <- responses %>%drop_na( oppose_or_support, Age, Sex, generalized_trust, risk_self_report, understanding_algorithmic_bias, understanding_ai, understanding_large_language_models, understanding_convolutional_neural_networks, trust_congress, trust_us_president, trust_average_american, trust_best_friend ) %>%transmute( oppose_or_support,age_decades_centered = (Age -mean(Age)) /10,Sex =factor( Sex,levels =c("Female", "Male") ),generalized_trust =factor( generalized_trust,levels =c("Careful", "Trusting") ),risk_willingness = risk_self_report,risk_willingness_centered = risk_willingness -mean(risk_willingness), understanding_ai, understanding_algorithmic_bias, understanding_large_language_models, understanding_convolutional_neural_networks, trust_congress, trust_us_president, trust_average_american, trust_best_friend )# Fit the full model using the same predictors as Model 4,# but predicting opposition/support for AI development.support_full_model <-lm( oppose_or_support ~ age_decades_centered + Sex + generalized_trust + risk_willingness_centered + understanding_ai + understanding_algorithmic_bias + understanding_large_language_models + understanding_convolutional_neural_networks + trust_congress + trust_us_president + trust_average_american + trust_best_friend,data = support_analysis_sample)# Extract coefficients and model-fit statistics.support_full_coefficients <- broom::tidy( support_full_model,conf.int =TRUE)support_full_fit <- broom::glance( support_full_model)# Display coefficient table.support_full_coefficients %>%mutate(term =recode( term,`(Intercept)`=paste("Intercept: average-age, average-risk woman in the Careful","group with neutral understanding and trust responses" ),age_decades_centered ="Age: 10-year increase",SexMale ="Men compared with women",generalized_trustTrusting ="Trusting compared with Careful",risk_willingness_centered ="Willingness to take risks: one-point increase",understanding_ai ="Understanding artificial intelligence",understanding_algorithmic_bias ="Understanding algorithmic bias",understanding_large_language_models ="Understanding large language models",understanding_convolutional_neural_networks ="Understanding convolutional neural networks",trust_congress ="Trust in Congress",trust_us_president ="Trust in the President",trust_average_american ="Trust in the average American",trust_best_friend ="Trust in my best friend" ) ) %>%select(Predictor = term,Estimate = estimate,`Standard error`= std.error,`95% CI lower`= conf.low,`95% CI upper`= conf.high,`p-value`= p.value ) %>%mutate(across(where(is.numeric), \(x) round(x, 3) ) ) %>% knitr::kable(caption =paste("Full model predicting opposition or support","for artificial intelligence development." ) )
Full model predicting opposition or support for artificial intelligence development.
Predictor
Estimate
Standard error
95% CI lower
95% CI upper
p-value
Intercept: average-age, average-risk woman in the Careful group with neutral understanding and trust responses
0.417
0.173
0.076
0.758
0.017
Age: 10-year increase
-0.042
0.041
-0.123
0.038
0.302
Men compared with women
0.610
0.126
0.363
0.856
0.000
Trusting compared with Careful
-0.027
0.142
-0.306
0.253
0.851
Willingness to take risks: one-point increase
0.058
0.029
0.000
0.115
0.050
Understanding artificial intelligence
0.083
0.058
-0.032
0.197
0.156
Understanding algorithmic bias
-0.096
0.054
-0.203
0.011
0.078
Understanding large language models
0.153
0.064
0.028
0.278
0.017
Understanding convolutional neural networks
-0.125
0.065
-0.252
0.003
0.056
Trust in Congress
0.145
0.058
0.031
0.259
0.013
Trust in the President
0.198
0.048
0.104
0.291
0.000
Trust in the average American
-0.008
0.057
-0.120
0.104
0.892
Trust in my best friend
0.010
0.064
-0.115
0.135
0.874
Code
# Display overall model fit.support_full_fit %>%transmute(N = nobs,`R²`= r.squared,`Adjusted R²`= adj.r.squared,`Model F`= statistic,`p-value`= p.value ) %>%mutate(across(where(is.numeric), \(x) round(x, 3) ) ) %>% knitr::kable(caption ="Fit of the full model predicting support for artificial intelligence development." )
Fit of the full model predicting support for artificial intelligence development.
N
R²
Adjusted R²
Model F
p-value
500
0.191
0.171
9.569
0
Code
visualize_support_coefficients <- support_full_coefficients %>%filter(term !="(Intercept)") %>%mutate(Predictor =recode( term,age_decades_centered ="Age: 10-year increase",SexMale ="Men compared with women",generalized_trustTrusting ="Trusting compared with Careful",risk_willingness_centered ="Willingness to take risks: one-point increase",understanding_ai ="Understanding artificial intelligence",understanding_algorithmic_bias ="Understanding algorithmic bias",understanding_large_language_models ="Understanding large language models",understanding_convolutional_neural_networks ="Understanding convolutional neural networks",trust_congress ="Trust in Congress",trust_us_president ="Trust in the President",trust_average_american ="Trust in the average American",trust_best_friend ="Trust in my best friend" ),Predictor =factor( Predictor,levels =rev(c("Age: 10-year increase","Men compared with women","Trusting compared with Careful","Willingness to take risks: one-point increase","Understanding artificial intelligence","Understanding algorithmic bias","Understanding large language models","Understanding convolutional neural networks","Trust in Congress","Trust in the President","Trust in the average American","Trust in my best friend" )) ) )support_predictor_caption <-paste0("Dots show estimated regression coefficients; whiskers show 95% confidence intervals.\n","Positive coefficients predict greater support for AI development; negative coeffs. predict greater opposition.\n", book_source_caption)visualize_support_coefficients %>%ggplot(aes(x = estimate,y = Predictor ) ) +geom_vline(xintercept =0,linetype ="dashed",linewidth =0.5,color ="#555555" ) +geom_errorbar(aes(xmin = conf.low,xmax = conf.high ),orientation ="y",width =0.15,linewidth =0.7 ) +geom_point(size =2.8 ) +labs(title ="What predicted support for AI development?",subtitle ="All predictors entered simultaneously",x ="Estimated change in support for AI development",y =NULL,caption = support_predictor_caption ) +theme_minimal(base_size =12) +theme(panel.grid.major.y =element_blank(),panel.grid.minor =element_blank(),plot.caption =element_text(size =10,color ="#666666",hjust =1 ) )
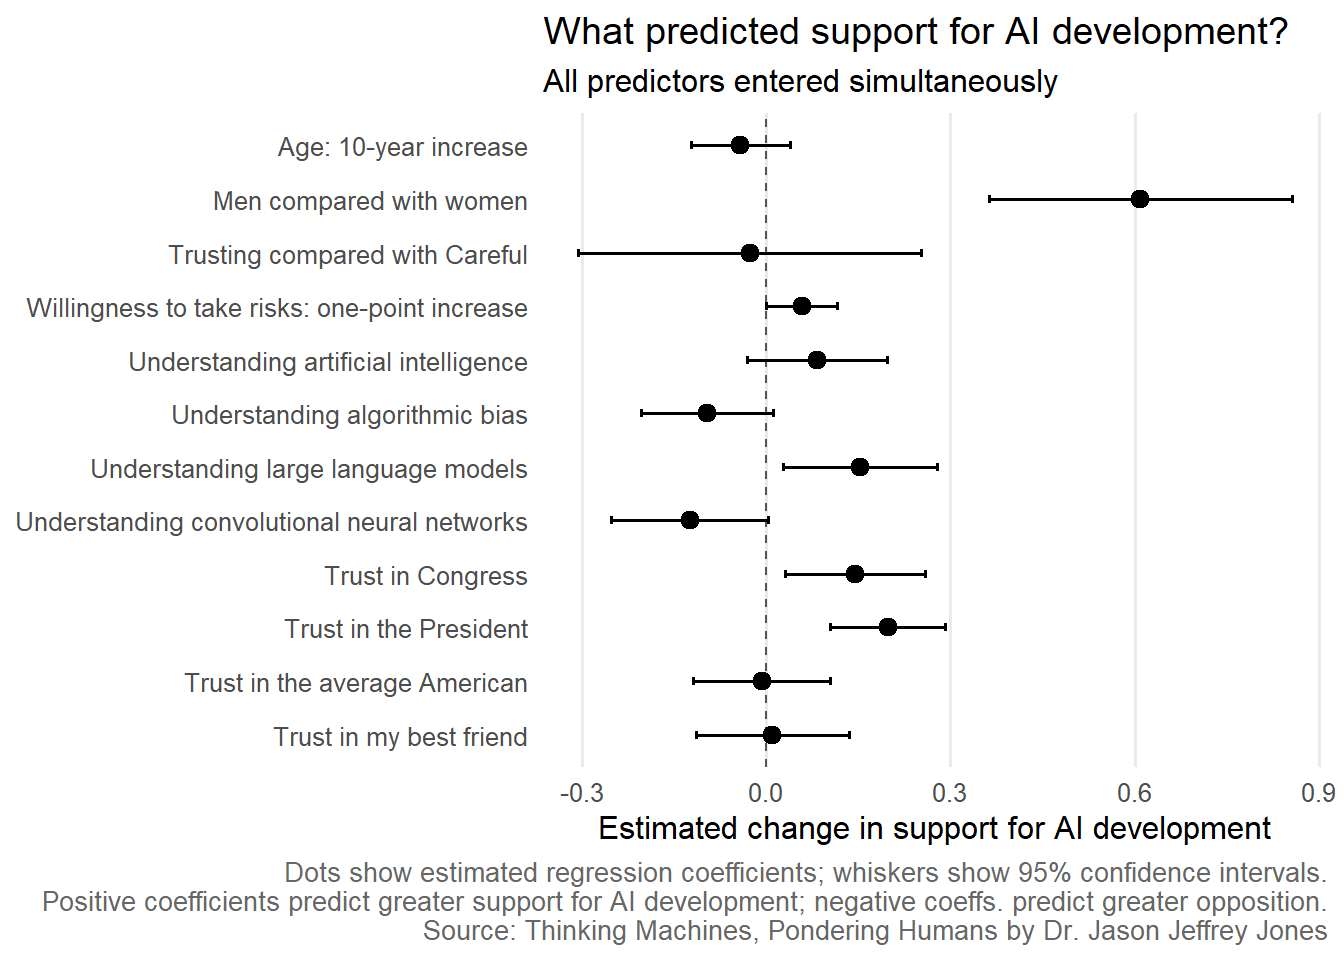
Figure 8.4: Predictors of support for artificial intelligence development. Dots show estimated regression coefficients and whiskers show 95% confidence intervals.
Higher trust in current politicians (Congress and the President) predicted stronger support for AI development. Interestingly, the more general trust items — trust in fellow Americans and generalized trust (Trusting vs. Careful) — did not.
Men more strongly supported AI development (as compared to Women). Age was not a strong predictor.
Among the understanding items, those who felt they understood large language models stood out as more supportive. Here, the coefficient for willingness to take risks was marginally significantly positive. It is instructive to compare this 2023 result to the evolving relationship of risk and support.
8.2 Survey Items, Respondents and Costs
8.2.1 Survey Items
The intent of these surveys was to contrast Americans’ trust in people and institutions to their trust in artificial intelligence.
Five items measured trust. On a seven-point scale, respondents were asked how much they agreed:
I trust artificial intelligence algorithms to do the right thing.
I trust Congress to do the right thing.
I trust the average American to do the right thing.
I trust the President to do the right thing.
I trust my best friend to do the right thing.
The items were exactly the same except the target of trust. The order of targets was randomly permuted for each respondent. All respondents were asked about every target. Thus, the protocol was a within-subject survey experiment. With this design, we can draw strong inferences about differences in trust.
One item measured AI Support.
How much do you oppose or support the development of Artificial Intelligence?
Other items measured generalized trust and risk preference:
Generally speaking, would you say that most people can be trusted or that you can’t be too careful in dealing with people?
How do you see yourself: are you generally a person who is fully prepared to take risks or do you try to avoid taking risks? Please choose a number, where the value 0 means: ‘not at all willing to take risks’ and the value 10 means: ‘very willing to take risks’.
Included in the survey were eight items intended to measure how familiar respondents were with computer technology generally and artificial intelligence specifically. Respondents were asked how much they agreed with each statement below. It was not expected that many (or any) respondents actually had a full understanding of any technology — the level of agreement was used as a proxy measure for their familiarity and experience.
I have a full understanding of algorithmic bias.
I have a full understanding of artificial intelligence.
I have a full understanding of large language models.
I have a full understanding of convolutional neural networks.
I have a full understanding of email.
I have a full understanding of phishing.
I have a full understanding of search engine optimization.
I have a full understanding of wireless routers.
8.2.2 Respondents
Respondents were recruited through Prolific Academic. I requested a representative sample of 500 American adults. Specifically, I chose the option “USA, Factors: Sex, Age, Ethnicity (Simplified US Census).”
To demonstrate the demographic coverage, below I provide the Sex and Age crosstab for this 2023 sample:
Code
library(knitr)# Bin ages.demosTable2023Trust = responses %>%rename(Age_Raw = Age) %>%select(Sex, Age_Raw)demosTable2023Trust = demosTable2023Trust %>%mutate(Age ="UNKNOWN" ) %>%mutate(Age =if_else(Age_Raw >=18& Age_Raw <25, "18-24", Age) ) %>%mutate(Age =if_else(Age_Raw >=25& Age_Raw <35, "25-34", Age) ) %>%mutate(Age =if_else(Age_Raw >=35& Age_Raw <45, "35-44", Age) ) %>%mutate(Age =if_else(Age_Raw >=45& Age_Raw <55, "45-54", Age) ) %>%mutate(Age =if_else(Age_Raw >=55& Age_Raw <65, "55-64", Age) ) %>%mutate(Age =if_else(Age_Raw >=65, "65+", Age) )# Generate percentage per demographic bin for each survey sample.demosTable2023Trust = demosTable2023Trust %>%filter(!is.na(Sex), !is.na(Age)) %>%group_by(Sex, Age) %>%summarise(N =n() ) %>%# Add totalN.ungroup() %>%mutate(totalN =sum(N) ) %>%# Now we can divide across each row to calculate a percentage.mutate(percent =round(100* N / totalN, 0) ) %>%select(-totalN)kable(demosTable2023Trust, format ="markdown")
Table 8.1
Sex
Age
N
percent
Female
18-24
28
6
Female
25-34
47
9
Female
35-44
46
9
Female
45-54
41
8
Female
55-64
60
12
Female
65+
36
7
Male
18-24
28
6
Male
25-34
50
10
Male
35-44
49
10
Male
45-54
38
8
Male
55-64
42
8
Male
65+
36
7
8.2.3 Costs
Each respondent was paid $0.60. Thus, the total of payments to respondents was $300 = 500 * $0.60.
Prolific Academic charged a Service fee equal to 33% of respondent payments. This totaled $100.
During this time, Prolific waived the Representative sample fee.
R code for analysis and visualization is embedded above (some formats) or available at TODO GITHUB/ZENODO.
TODO create and link GitHub repo that has all the raw files. Manually exclude _cache directories.
8.4 Summary and What’s Next
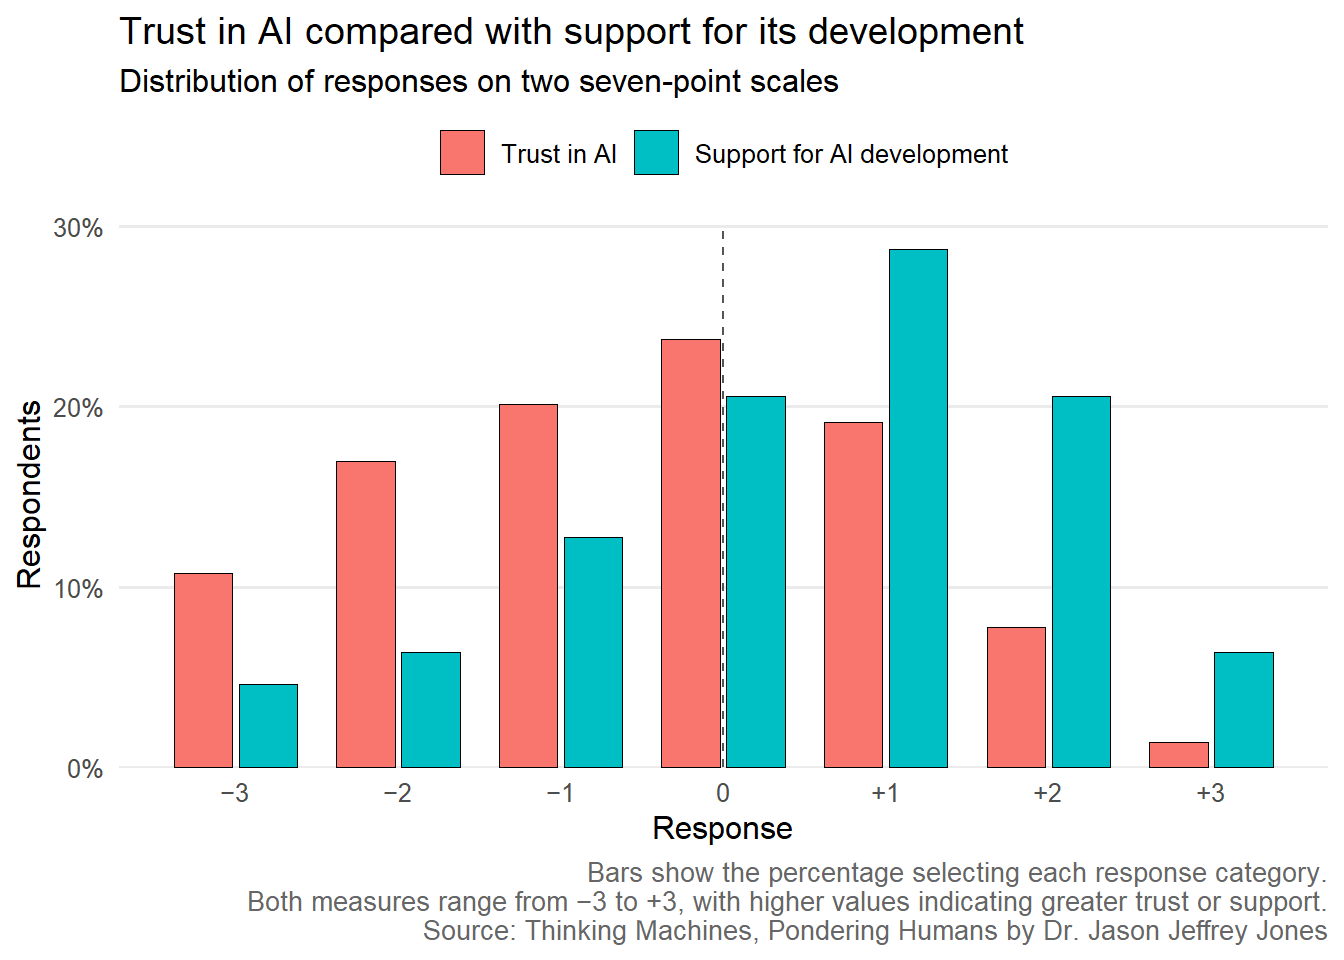
We learned a lot in this chapter, but the first thing I want to draw attention to is the contrast between AI Support and trust. Despite the fact that Americans did not trust artificial intelligence algorithms to do the right thing, they still supported further development. Let’s view the distributions first, then consider the contrast.
Code
# Reshape trust and support into long format.trust_support_long <- responses %>%select( trust_ai, oppose_or_support ) %>%pivot_longer(cols =everything(),names_to ="Measure",values_to ="Response" ) %>%mutate(Measure =recode( Measure,trust_ai ="Trust in AI",oppose_or_support ="Support for AI development" ),Measure =factor( Measure,levels =c("Trust in AI","Support for AI development" ) ) )# Calculate the percentage selecting each response category.visualize_trust_support <- trust_support_long %>%filter(!is.na(Response)) %>%count( Measure, Response,name ="n" ) %>%group_by(Measure) %>%complete(Response =-3:3,fill =list(n =0) ) %>%mutate(percent = n /sum(n) ) %>%ungroup()trust_support_caption <-paste0("Bars show the percentage selecting each response category.\n","Both measures range from −3 to +3, with higher values indicating greater trust or support.\n", book_source_caption)visualize_trust_support %>%ggplot(aes(x = Response,y = percent,fill = Measure ) ) +geom_col(position =position_dodge(width =0.8),width =0.72,color ="black",linewidth =0.3 ) +geom_vline(xintercept =0,linetype ="dashed",linewidth =0.4,color ="#555555" ) +scale_x_continuous(breaks =-3:3,minor_breaks =NULL,labels =c("−3","−2","−1","0","+1","+2","+3" ) ) +scale_y_continuous(labels = scales::label_percent(accuracy =1),breaks = scales::breaks_width(0.1),minor_breaks =NULL,expand =expansion(mult =c(0, 0.05)) ) +labs(title ="Trust in AI compared with support for its development",subtitle ="Distribution of responses on two seven-point scales",x ="Response",y ="Respondents",fill =NULL,caption = trust_support_caption ) +theme_minimal(base_size =12) +theme(panel.grid.major.x =element_blank(),panel.grid.minor =element_blank(),legend.position ="top",plot.caption =element_text(size =10,color ="#666666",hjust =1 ) )
Figure 8.5: Distributions of trust in artificial intelligence and support for artificial intelligence development. Mean support was about 1 point higher than trust, 95% confidence interval [0.86,1.08].
In Figure 8.5, I see active distrust toward AI. Yet at the same time, the bulk of respondents favored more development. Let’s imagine some interpretations:
Americans were techno-optimists. They believed AI could not be trusted on its own in 2023, but they believed further development would create better-aligned AI in the future.
Americans saw a tradeoff. The advantages of AI development (faster economic growth, perhaps) were worth the disadvantages of untrusted automated systems that might be amoral.
Americans underreported their trust, but not support. Note that Congress and the President were not trusted, but were elected.
These are three very different scenarios. Unfortunately, the current data does not offer any immediate path to choose one explanation over the others. The most straightforward solution would be to ask respondents why they support further development of a technology they do not trust. I plan to follow that thread in future research.
8.4.1 Which Americans trusted artificial intelligence and who supported more development?
With the nested models in Section 8.1.1.4, I made the data do its best to explain why some respondents reported higher trust in AI than others. The final model — that explained 30% of the variance — pointed to a handful of predictors that I squashed into Robert and Susan personifications.
Results were similar for who supported further development of AI. Modelling would predict greater AI Support form Robert than Susan.
One fantastic thing about surveys is that they can be repeated. In this Chapter we have a 2023 snapshot of average trust and support. The observations provide (momentary) estimates for the relationship between attitudes and personal characteristics. I am continuing this work through daily repeated surveys. This has revealed that some relationships are dynamic. For instance, in 2023 the Age and AI Support relationship was unremarkable, not distinguishable from flat (by a strict p < 0.05 criterion).
The next chapter continues to examine attitudes from the perspective that the American adults surveyed are also voters. I will compare Americans’ preferences for government funding of AI development. I use a survey experiment again, so that I can directly Compare AI Support to Other Technologies.
Following attitudes toward AI in the early 2020s made one thing clear. To draw conclusions that were clear, accurate and currently relevant, I needed more data. That led me to build my own infrastructure for daily repeating surveys. Skip to the A Golden Age of Daily Surveys if that’s what excites you.