Just browsing the web in the 2020s, it was easy to find conceptions of artificial intelligence ranging from killer robot through stochastic parrot to ideal romantic partner. But these discussions originated from a small, self-selected group. Most people write very little and most writing is ignored.
If you want to know what people - in general - think, the gold standard is still a representative sample survey.
I do want to know what people think about artificial intelligence. So, for many years I conducted representative sample surveys of Americans and probed their reactions to a variety of survey items. In the following chapters, I will show you with graphs, words and statistics what I discovered.
1.2 A Big Picture
Let’s start with a picture. I want to illustrate how we can compare responses to survey items and learn something.
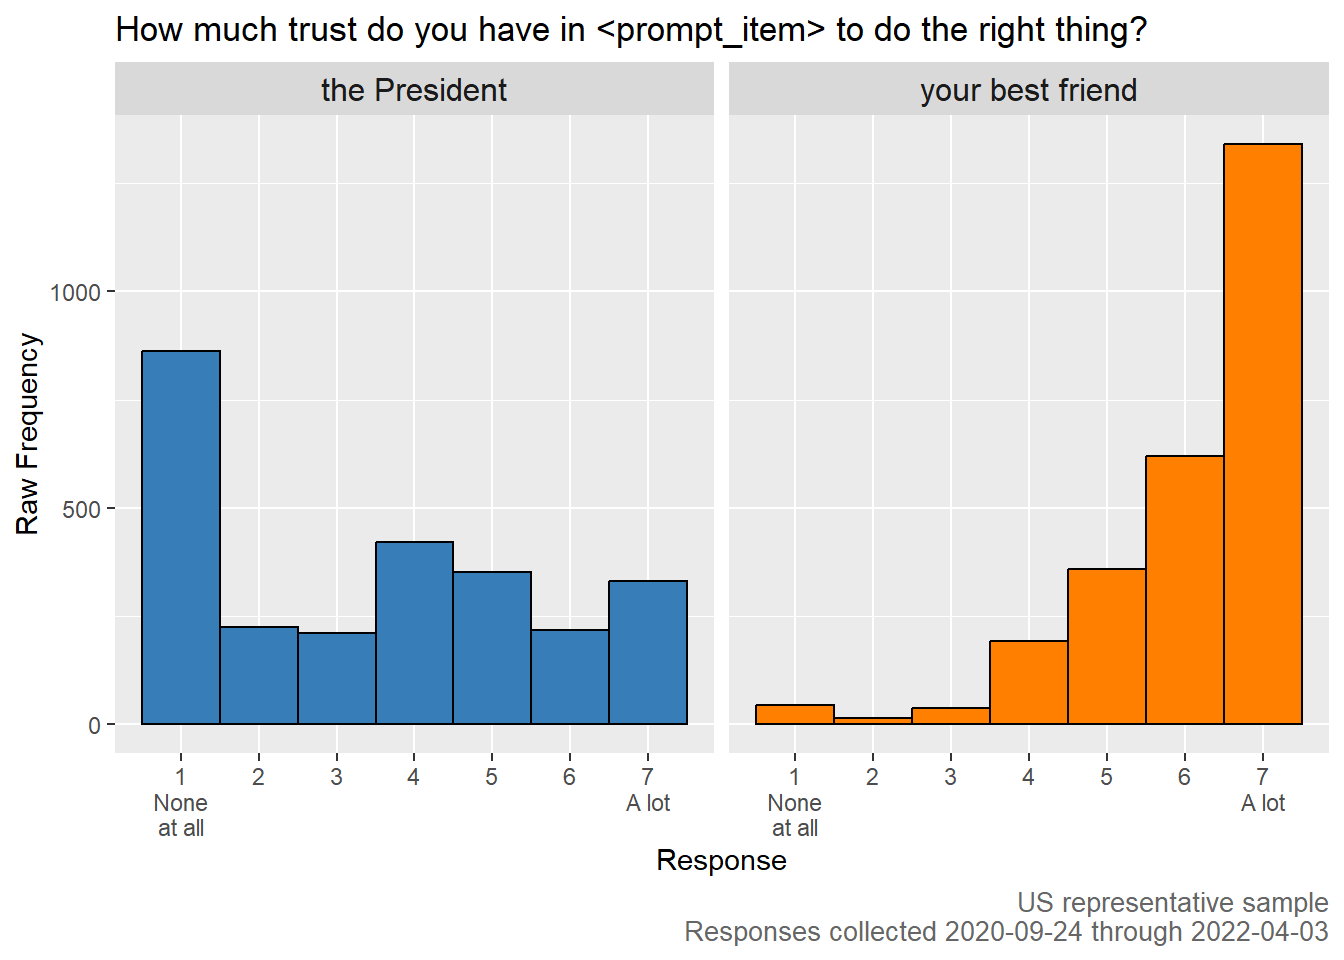
Ask yourself: who does the average American trust more - the President or their best friend? I imagine you share my strong intuition that it’s the best friend. As it happens, I asked representative samples of 2500 Americans questions that looked like this: How much trust do you have in prompt-item to do the right thing?
Here are the results when prompt-item was replaced with your best friend contrasted with the results when prompt-item was replaced with the President.
Code
library(tidyverse)# The file stacked-oneq-results.csv contains data from 2020 through 2022 OneQ surveys.# For the original presentation of this data, see https://jasonjones.ninja/jones-skiena-public-opinion-of-ai/# Download the file from a public Open Science Framework repository at https://osf.io/download/3kuas/oneq =read_csv("data/stacked-oneq-results.csv")trust_oneq = oneq %>%filter(grepl("How much trust do you have in ", Full_Prompt)) %>%mutate(prompt_item =gsub("How much trust do you have in ", "", Full_Prompt)) %>%mutate(prompt_item =gsub(" to do the right thing\\?", "", prompt_item)) %>%mutate(prompt_item =factor(prompt_item, levels =c("Congress", "the President", "artificial intelligence algorithms", "the average American", "your best friend")) )trust_earliest =min(trust_oneq$Survey_Date)trust_latest =max(trust_oneq$Survey_Date)trust_caption =paste0("US representative sample\nResponses collected ", trust_earliest, " through ", trust_latest)trust_colors =c("Congress"="#E41A1C", "the President"="#377EB8", "artificial intelligence algorithms"="#4DAF4A", "the average American"="#984EA3", "your best friend"="#FF7F00")# Create a histogram of responses for trust in 'the President' and 'your best friend' only.trust_oneq %>%filter(prompt_item %in%c("the President", "your best friend")) %>%ggplot(aes(x = Response, fill = prompt_item)) +geom_histogram(binwidth =1, color ="black") +ggtitle("How much trust do you have in <prompt_item> to do the right thing?") +#xlab("Response: None at all==1. A lot==7.") + ylab("Raw Frequency") +#scale_x_continuous(breaks = 1:7, labels = c("1", "2", "3", "4", "5", "6", "7"), minor_breaks = NULL) + scale_x_continuous(breaks =1:7, minor_breaks =NULL, labels =c("1\nNone\nat all", "2", "3", "4", "5", "6", "7\nA lot")) +scale_fill_manual(values = trust_colors) +labs(caption =`trust_caption`) +theme(legend.position ="none") +theme(strip.text.x =element_text(size=12)) +theme(plot.caption =element_text(size=10, color ="#666666")) +facet_wrap(~ prompt_item, nrow =1)
Mean trust in the President to do the right thing was 3.4 where 1 indicated ‘None at all’ and 7 indicated ‘A lot’. Mean trust for ‘your best friend’ was 6.1.
We were right! Americans trust their best friends a lot, but not the President.
1.3 Did American Adults Trust AI to Do the Right Thing?
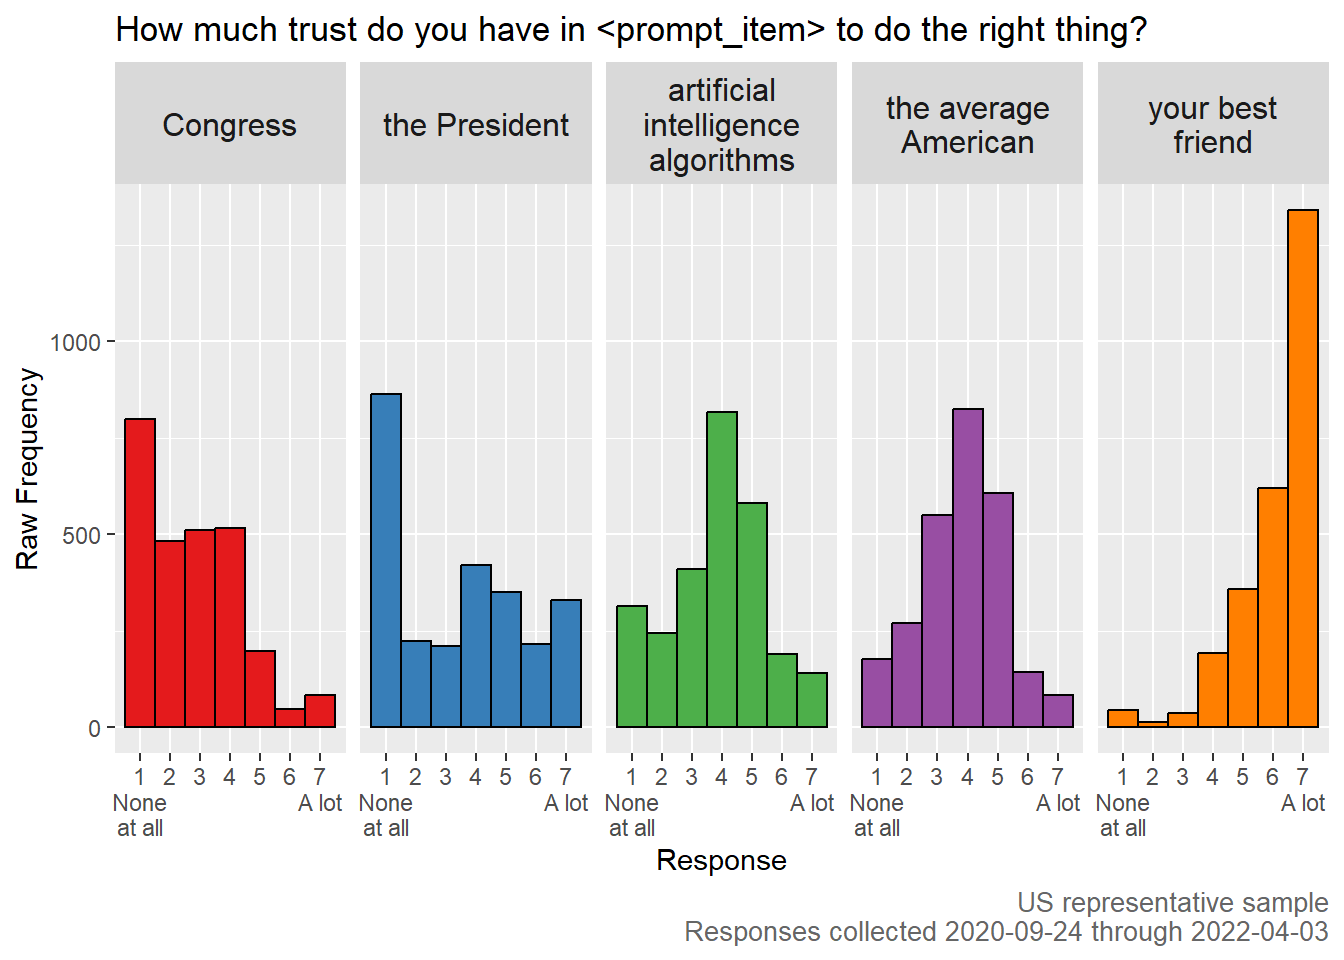
But remember, we’re here to measure public perception of artificial intelligence. It’s a good thing that I also ran surveys replacing prompt-item with artificial intelligence algorithms. And Congress and the average American. It’s good to know if Americans trust AI to do the right thing, and doubly-good to have other items for comparison.
Code
# Create a histogram of responses for trust for all prompt_item values.trust_oneq %>%ggplot(aes(x = Response, fill = prompt_item)) +geom_histogram(binwidth =1, color ="black") +ggtitle("How much trust do you have in <prompt_item> to do the right thing?") +ylab("Raw Frequency") +scale_x_continuous(breaks =1:7, minor_breaks =NULL, labels =c("1\nNone\nat all", "2", "3", "4", "5", "6", "7\nA lot")) +scale_fill_manual(values = trust_colors) +labs(caption =`trust_caption`) +theme(legend.position ="none") +theme(strip.text.x =element_text(size=12)) +theme(plot.caption =element_text(size=10, color ="#666666")) +facet_wrap(~ prompt_item, nrow =1, labeller =label_wrap_gen(width =14))
Americans reported more trust in artificial intelligence algorithms than Congress or the President. They trusted their best friend more. The nearest comparison was ‘the average American.’
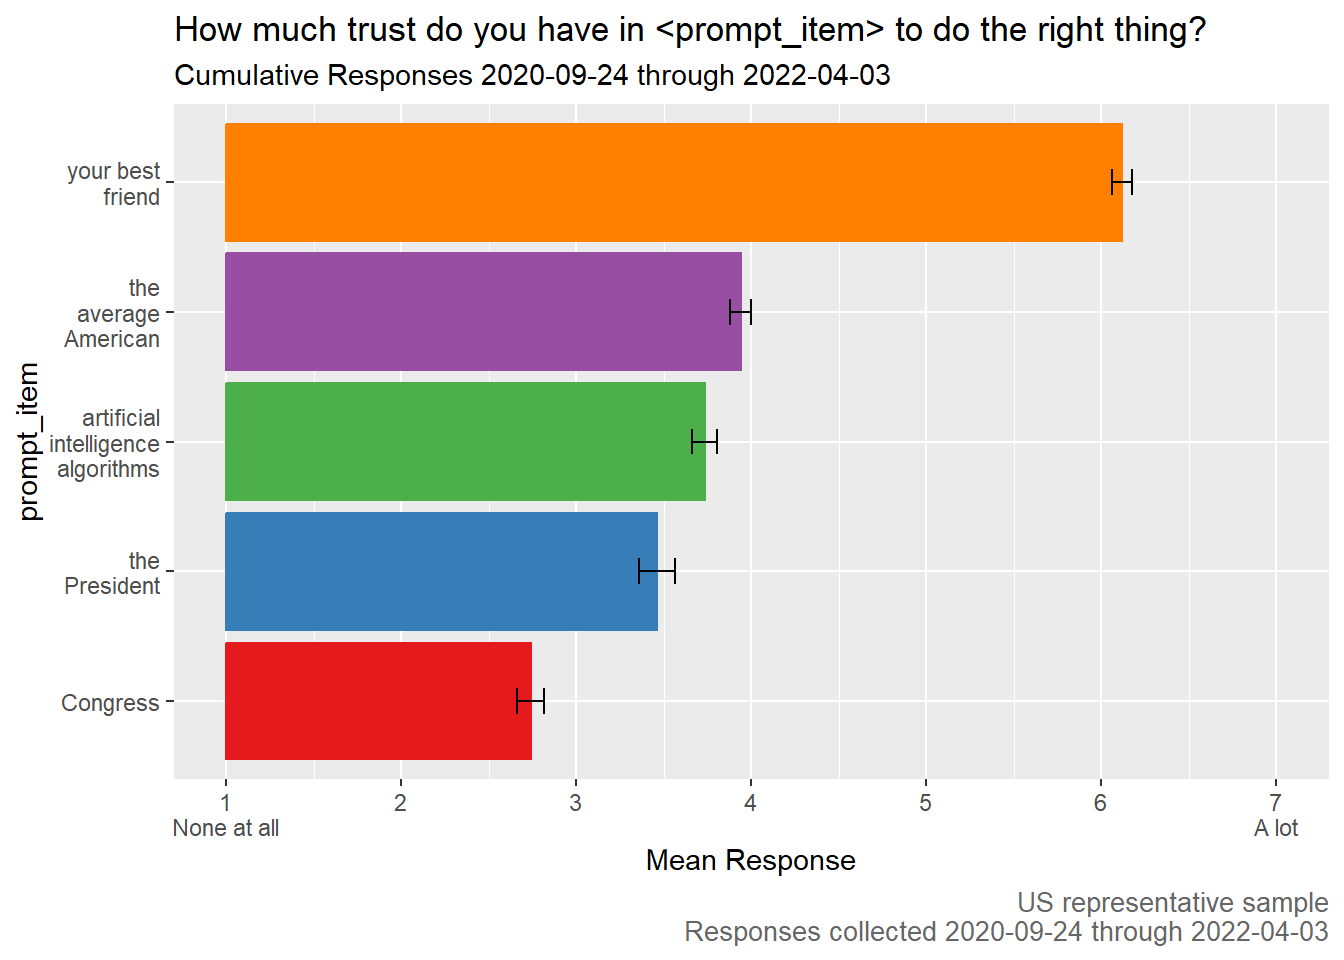
Even if you love histograms like me, that’s too many bars. Let’s summarize the information with one bar representing the average for each prompt-item.
Code
# Calculate the average trust rating per prompt_item.# We have to use survey package to get correct inference and variance estimates.library(survey)trust_oneq_survey =svydesign(data = trust_oneq, ids =~User_ID, weights =~Weight)# Descriptive results.svyby(~Response, by =~prompt_item, design = trust_oneq_survey, FUN=svymean, vartype ="ci")# Look at effects of prompt_item.summary(svyglm(Response ~ prompt_item, design = trust_oneq_survey))# Put the svyby results into a visualization.# First, build the dataframe.visualize_trust_means =svyby(~Response, by =~prompt_item, design = trust_oneq_survey, FUN=svymean, vartype ="ci")library(scales)visualize_trust_means %>%# In ggplot, bars must start at zero. So shift data and labels.mutate(Response = Response -1.0) %>%mutate(ci_l = ci_l -1.0) %>%mutate(ci_u = ci_u -1.0) %>%# Add a newline to ai algs so it doesn't take up so much space.#mutate(prompt_item = gsub("artificial intelligence algorithms", "artificial intelligence\nalgorithms", prompt_item)) %>%ggplot(aes(x = prompt_item, y = Response, color = prompt_item, fill = prompt_item)) +geom_bar(stat='identity') +geom_errorbar(aes(ymin = ci_l, ymax = ci_u), color="black", width=0.2) +ggtitle("How much trust do you have in <prompt_item> to do the right thing?", paste0("Cumulative Responses ", trust_earliest, " through ", trust_latest)) +xlab("prompt_item") +ylab("Mean Response") +# Apply labels with wrapping.scale_x_discrete(labels =label_wrap(10)) +# Force y scale to 1 through 7. Put numbers 1:7 on y-axis. Add None at all and A lot as labels.scale_y_continuous(limits =c(0,6), breaks =0:6, labels =c("1\nNone at all", "2", "3", "4", "5", "6", "7\nA lot")) +# Use trust_colors for bar colors.scale_color_manual(values = trust_colors) +scale_fill_manual(values = trust_colors) +labs(caption = trust_caption) +theme(plot.caption =element_text(size=10, color ="#666666")) +# The legend has only redundant information. Get rid of it.theme(legend.position ="none") +coord_flip()
The results of a survey experiment. Different respondents were presented different words in place of ‘prompt_item’. Representative samples of American adults reported a level of trust in ‘artificial intelligence algorithms’ exceeding that of Congress and the President, but below that for the average American and their best friend.
In April of 2022, I summarized these results this way: On average, the American public trusts “artificial intelligence algorithms” to do the right thing just a little less than they trust the average American. Americans trust artificial intelligence algorithms more than Congress or the President, but not as much as their best friend.
1.4 Open Data and Code
Notice that in this book I have included the R code to produce each figure. Also notice that you can download the full response microdata from publicly available websites: the Thinking Machines, Pondering Humans data repository and also available at this Zenodo mirror. This means you can inspect the data yourself. You can reproduce the results you see here. Or you can run your own analysis.
1.5 Next Chapter: Artificial General Intelligence
We’ve learned where Americans rank artificial intelligence algorithms in terms of trust. Next, let’s allow Americans to speculate a bit. What do they think about artificial general intelligence (AGI)?