Jones-Skiena Public Opinion of Artificial Intelligence Dashboard
2021-12-22 Update
 -- Dr. Jason Jeffrey Jones -- @jasonjones_jjj
 -- Dr. Steven Sol Skiena -- @stevenskiena
Support for the Development of Artificial Intelligence
We deliver the following survey item every week to a random, representative sample of 100 Americans:
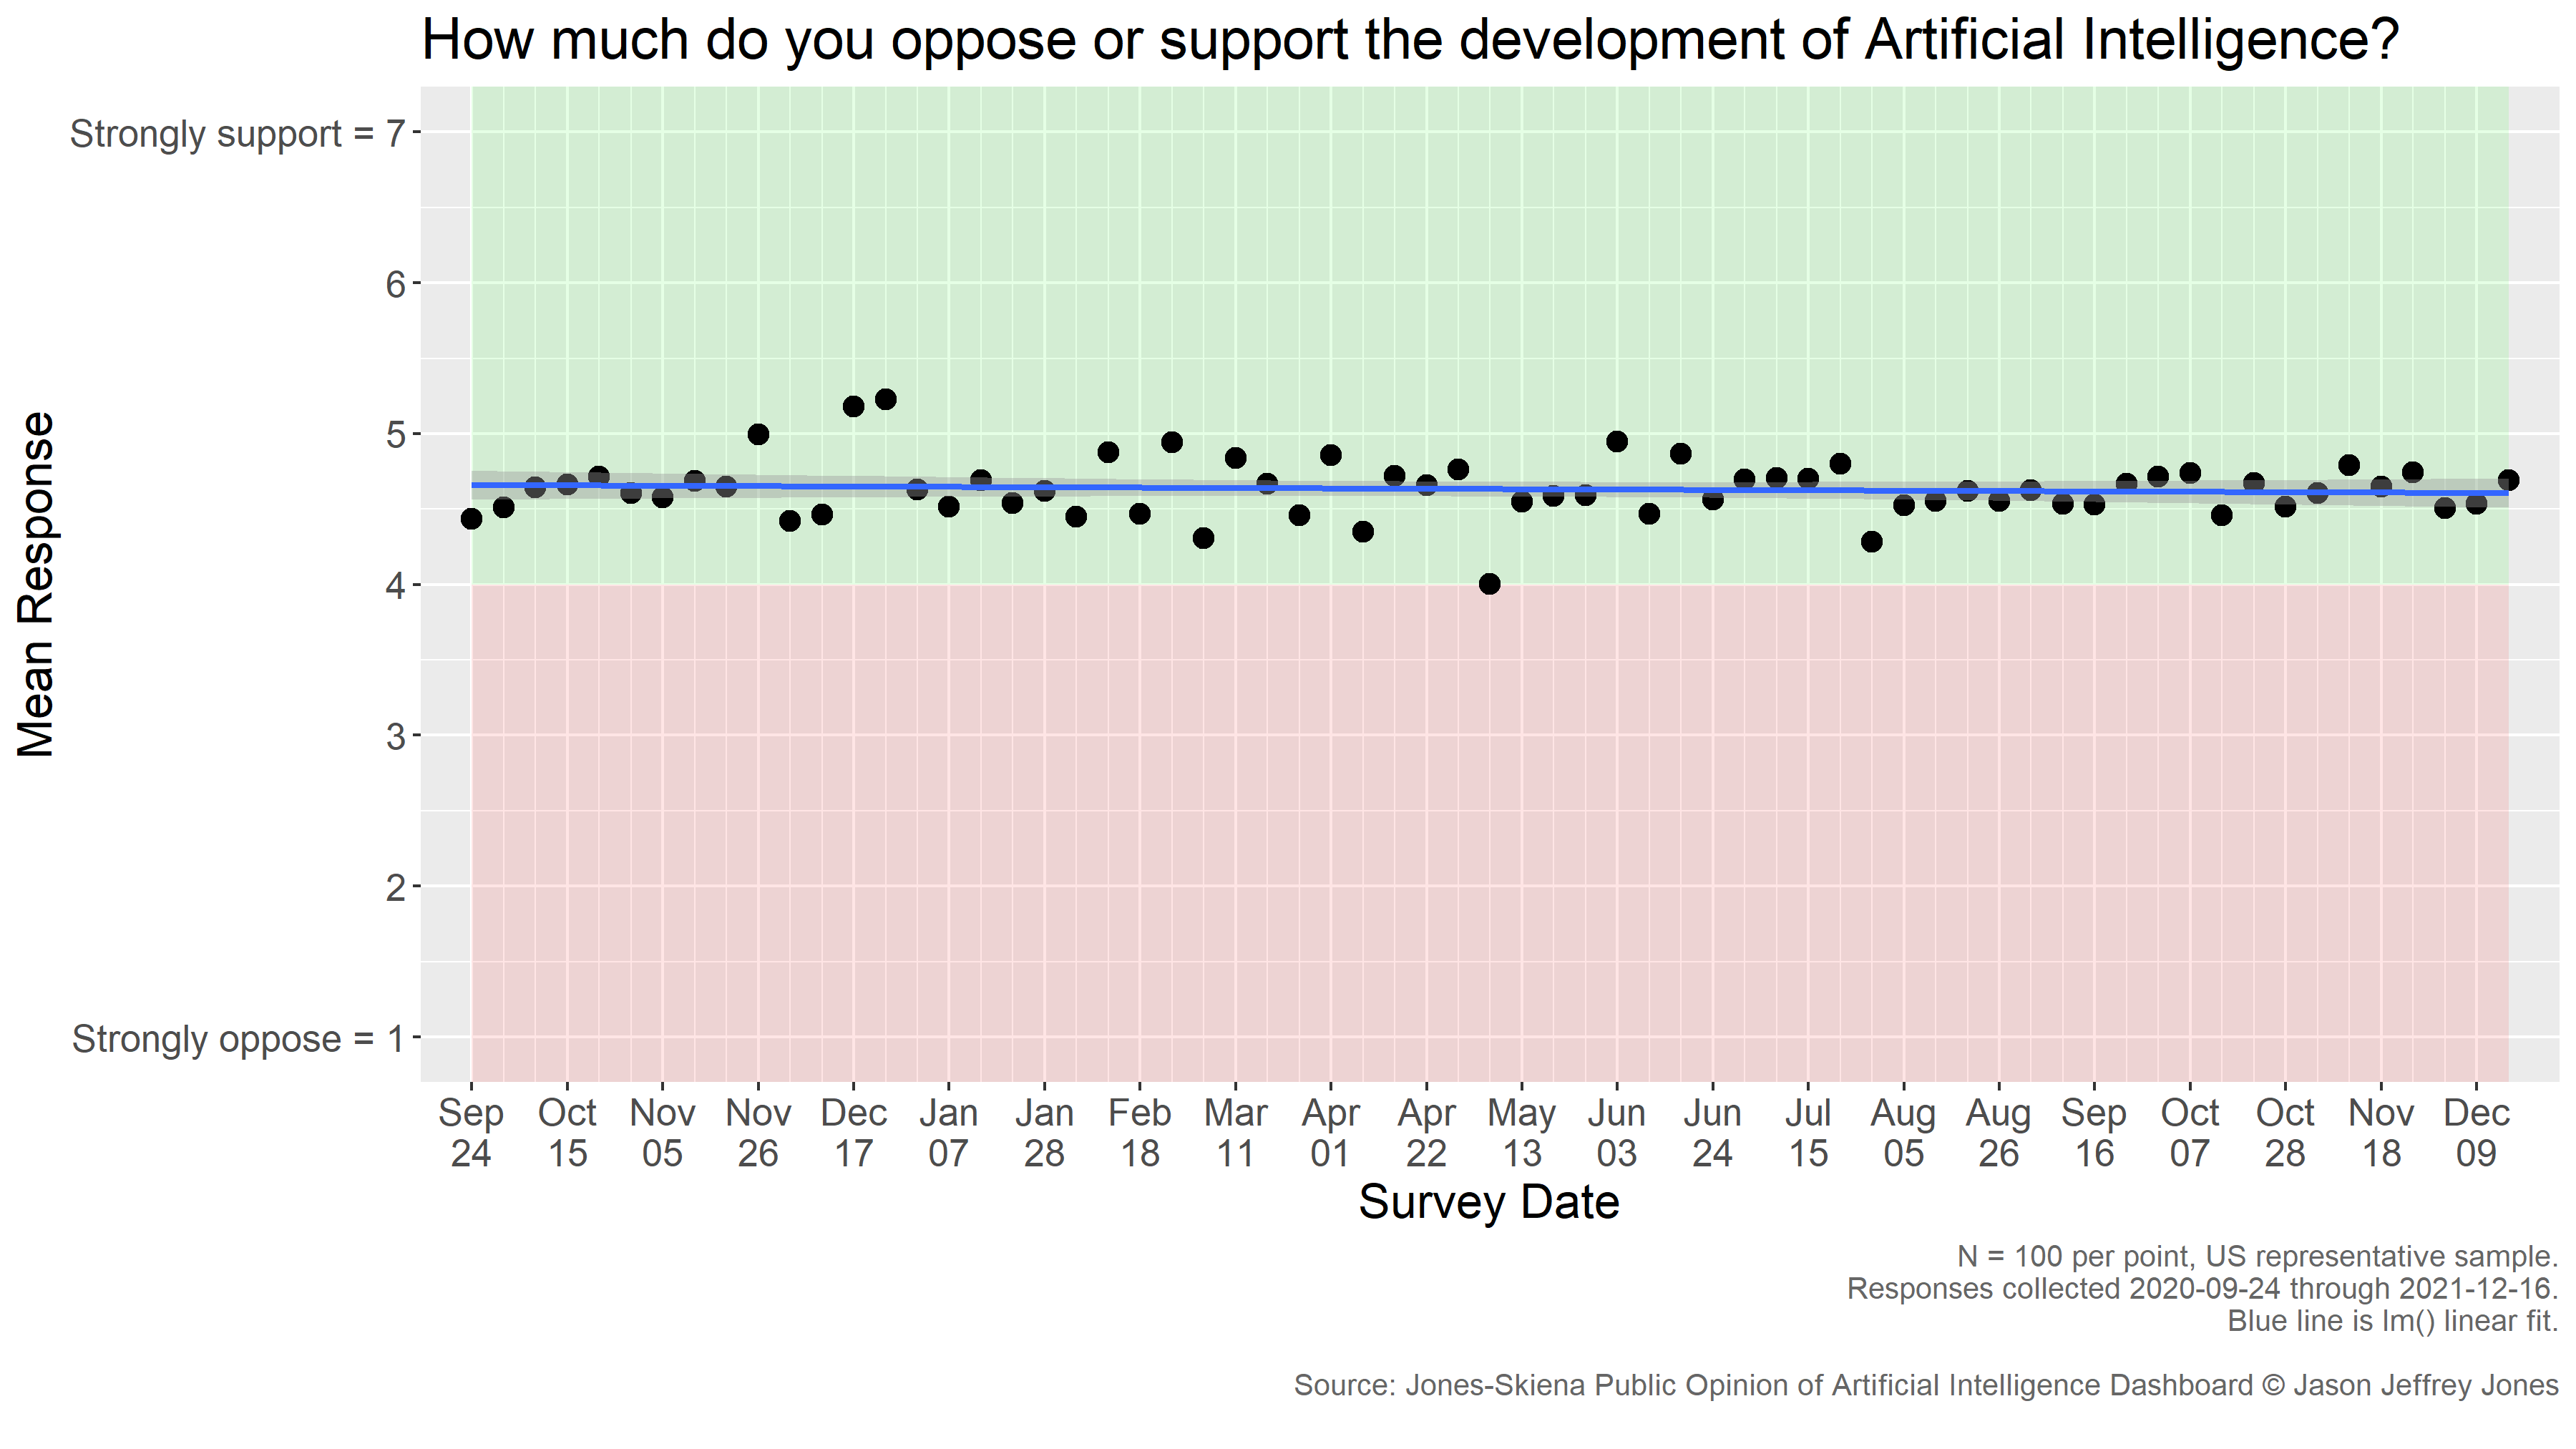
How much do you oppose or support the development of Artificial Intelligence?
The mean response per week and a linear trend are presented below.
Interpretation
On average, the American public supports the development of Artificial Intelligence. In the data from December 16, 2021, the estimated mean response is 4.69, with a 95% confidence interval of 4.34-5.04. On our 7-point scale (labeled "Strongly oppose" at one end and "Strongly support" at the other) a value of 4 indicates indifference, any value below that opposition and any point above support.
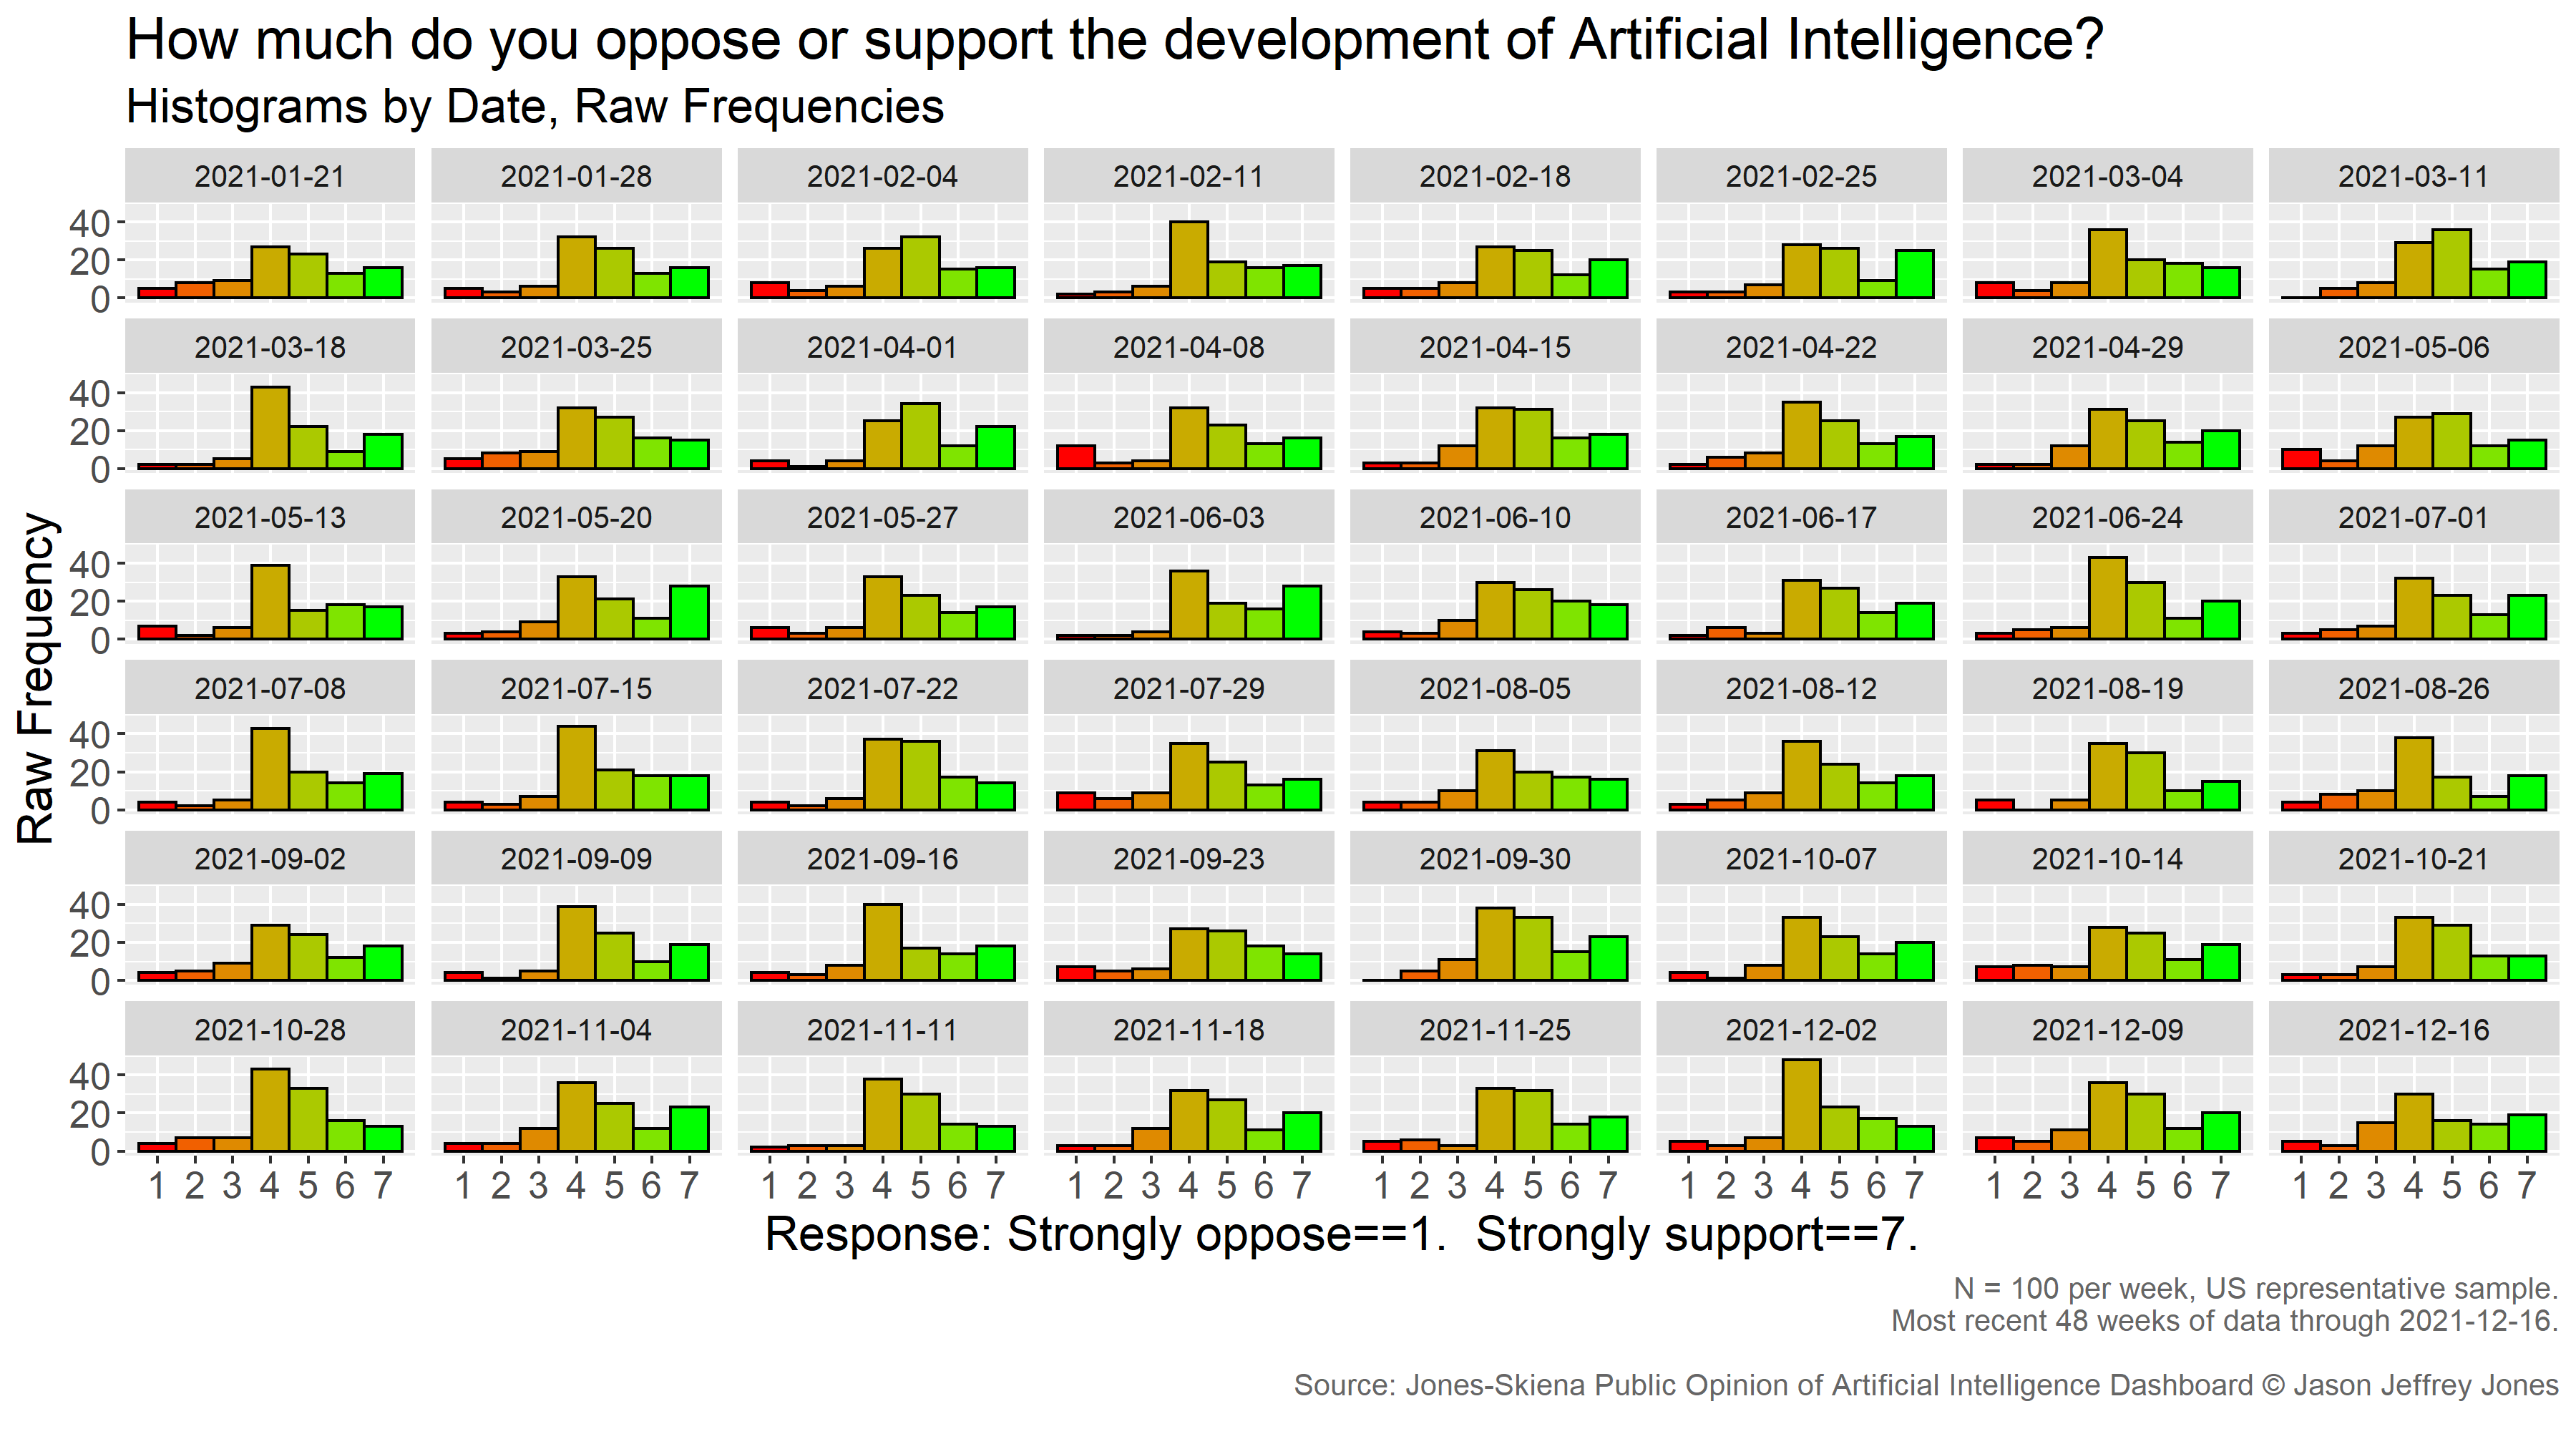
In 65 weeks of running this same survey item, we have never observed a mean estimate below the midpoint of the scale. It is always useful to observe the raw frequency of responses as a set of histograms. One can see that the modal (most frequent) response is typically 4, the midpoint of the scale, which we interpret as indifference. Americans are generally neutral on this question, but among those who are not, there are more on the Support end of the scale than the Oppose end.
Notwithstanding a few outlier weeks, the data point toward stable support. A linear fit of mean estimates over weeks returns a slope not statistically significantly different from zero.
Interested in how support for AI compares to other technologies? Interested in sub-population comparisons on gender and age? Check out the results of our Contextualizing Support for AI Development Survey.
Trust in Artificial Intelligence
NEW DATA! Updated 2021-12-22.
We deliver items of the following form every month to a random, representative sample of 100 Americans:
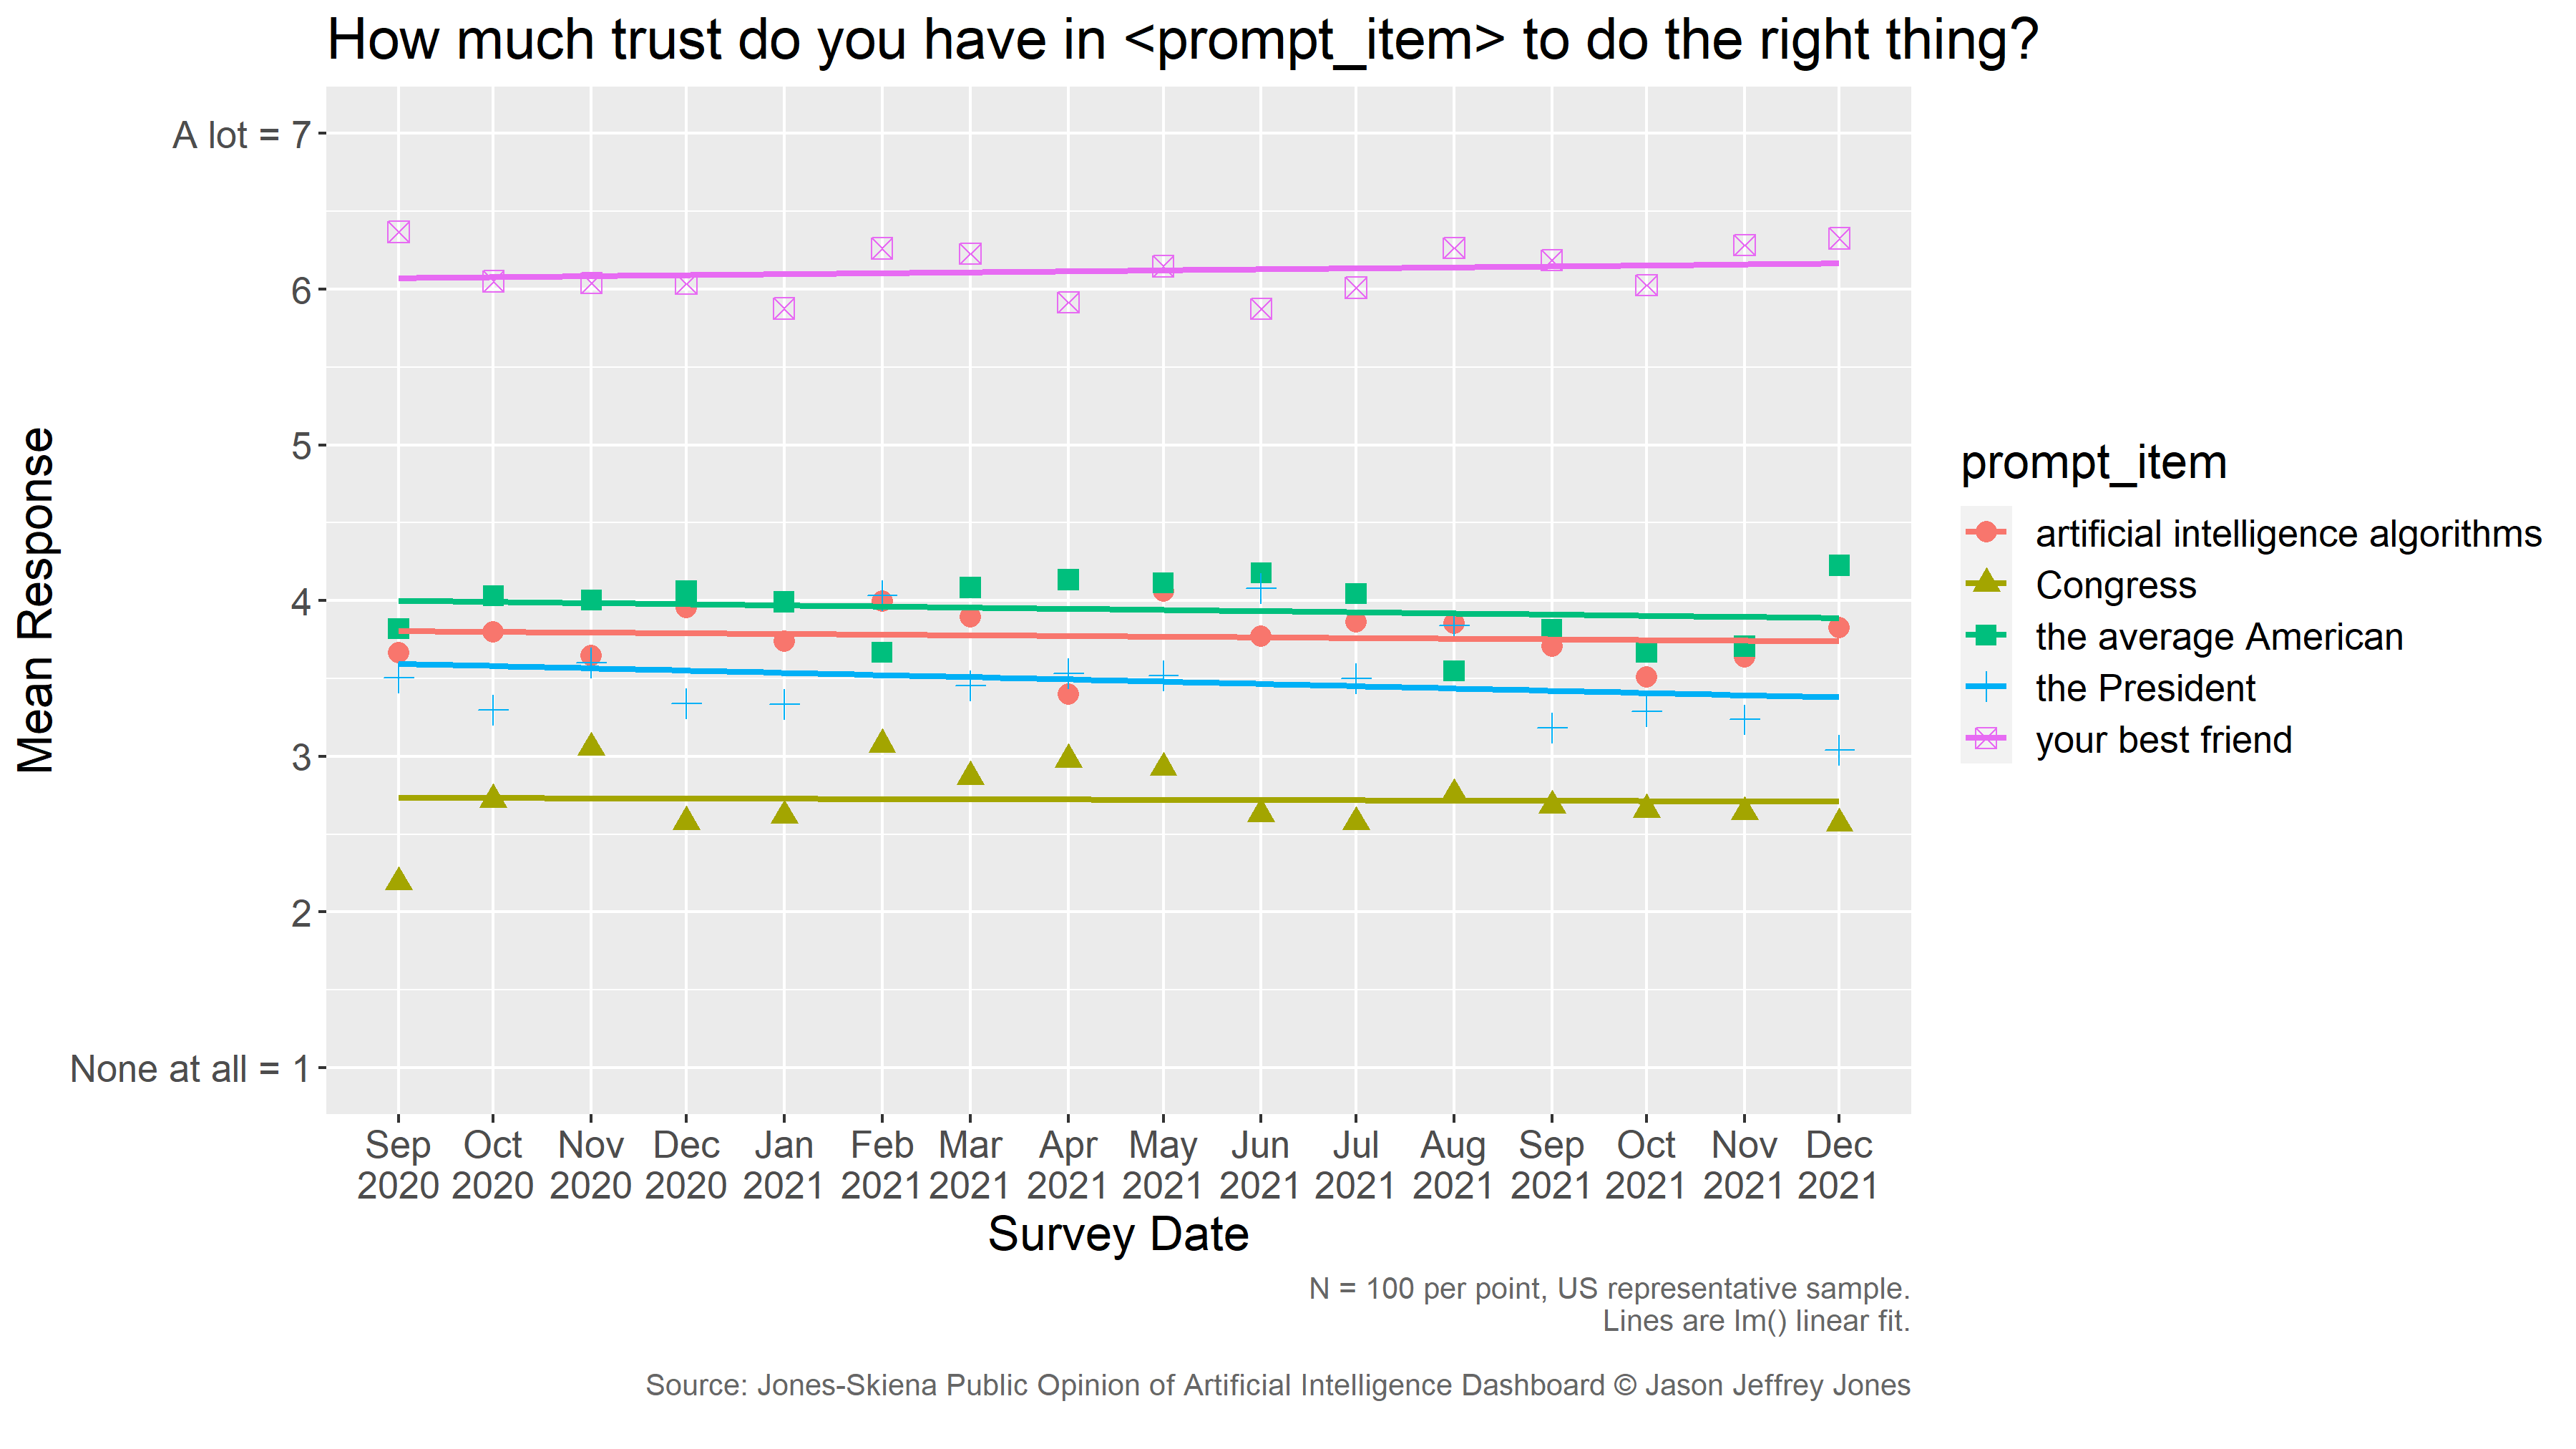
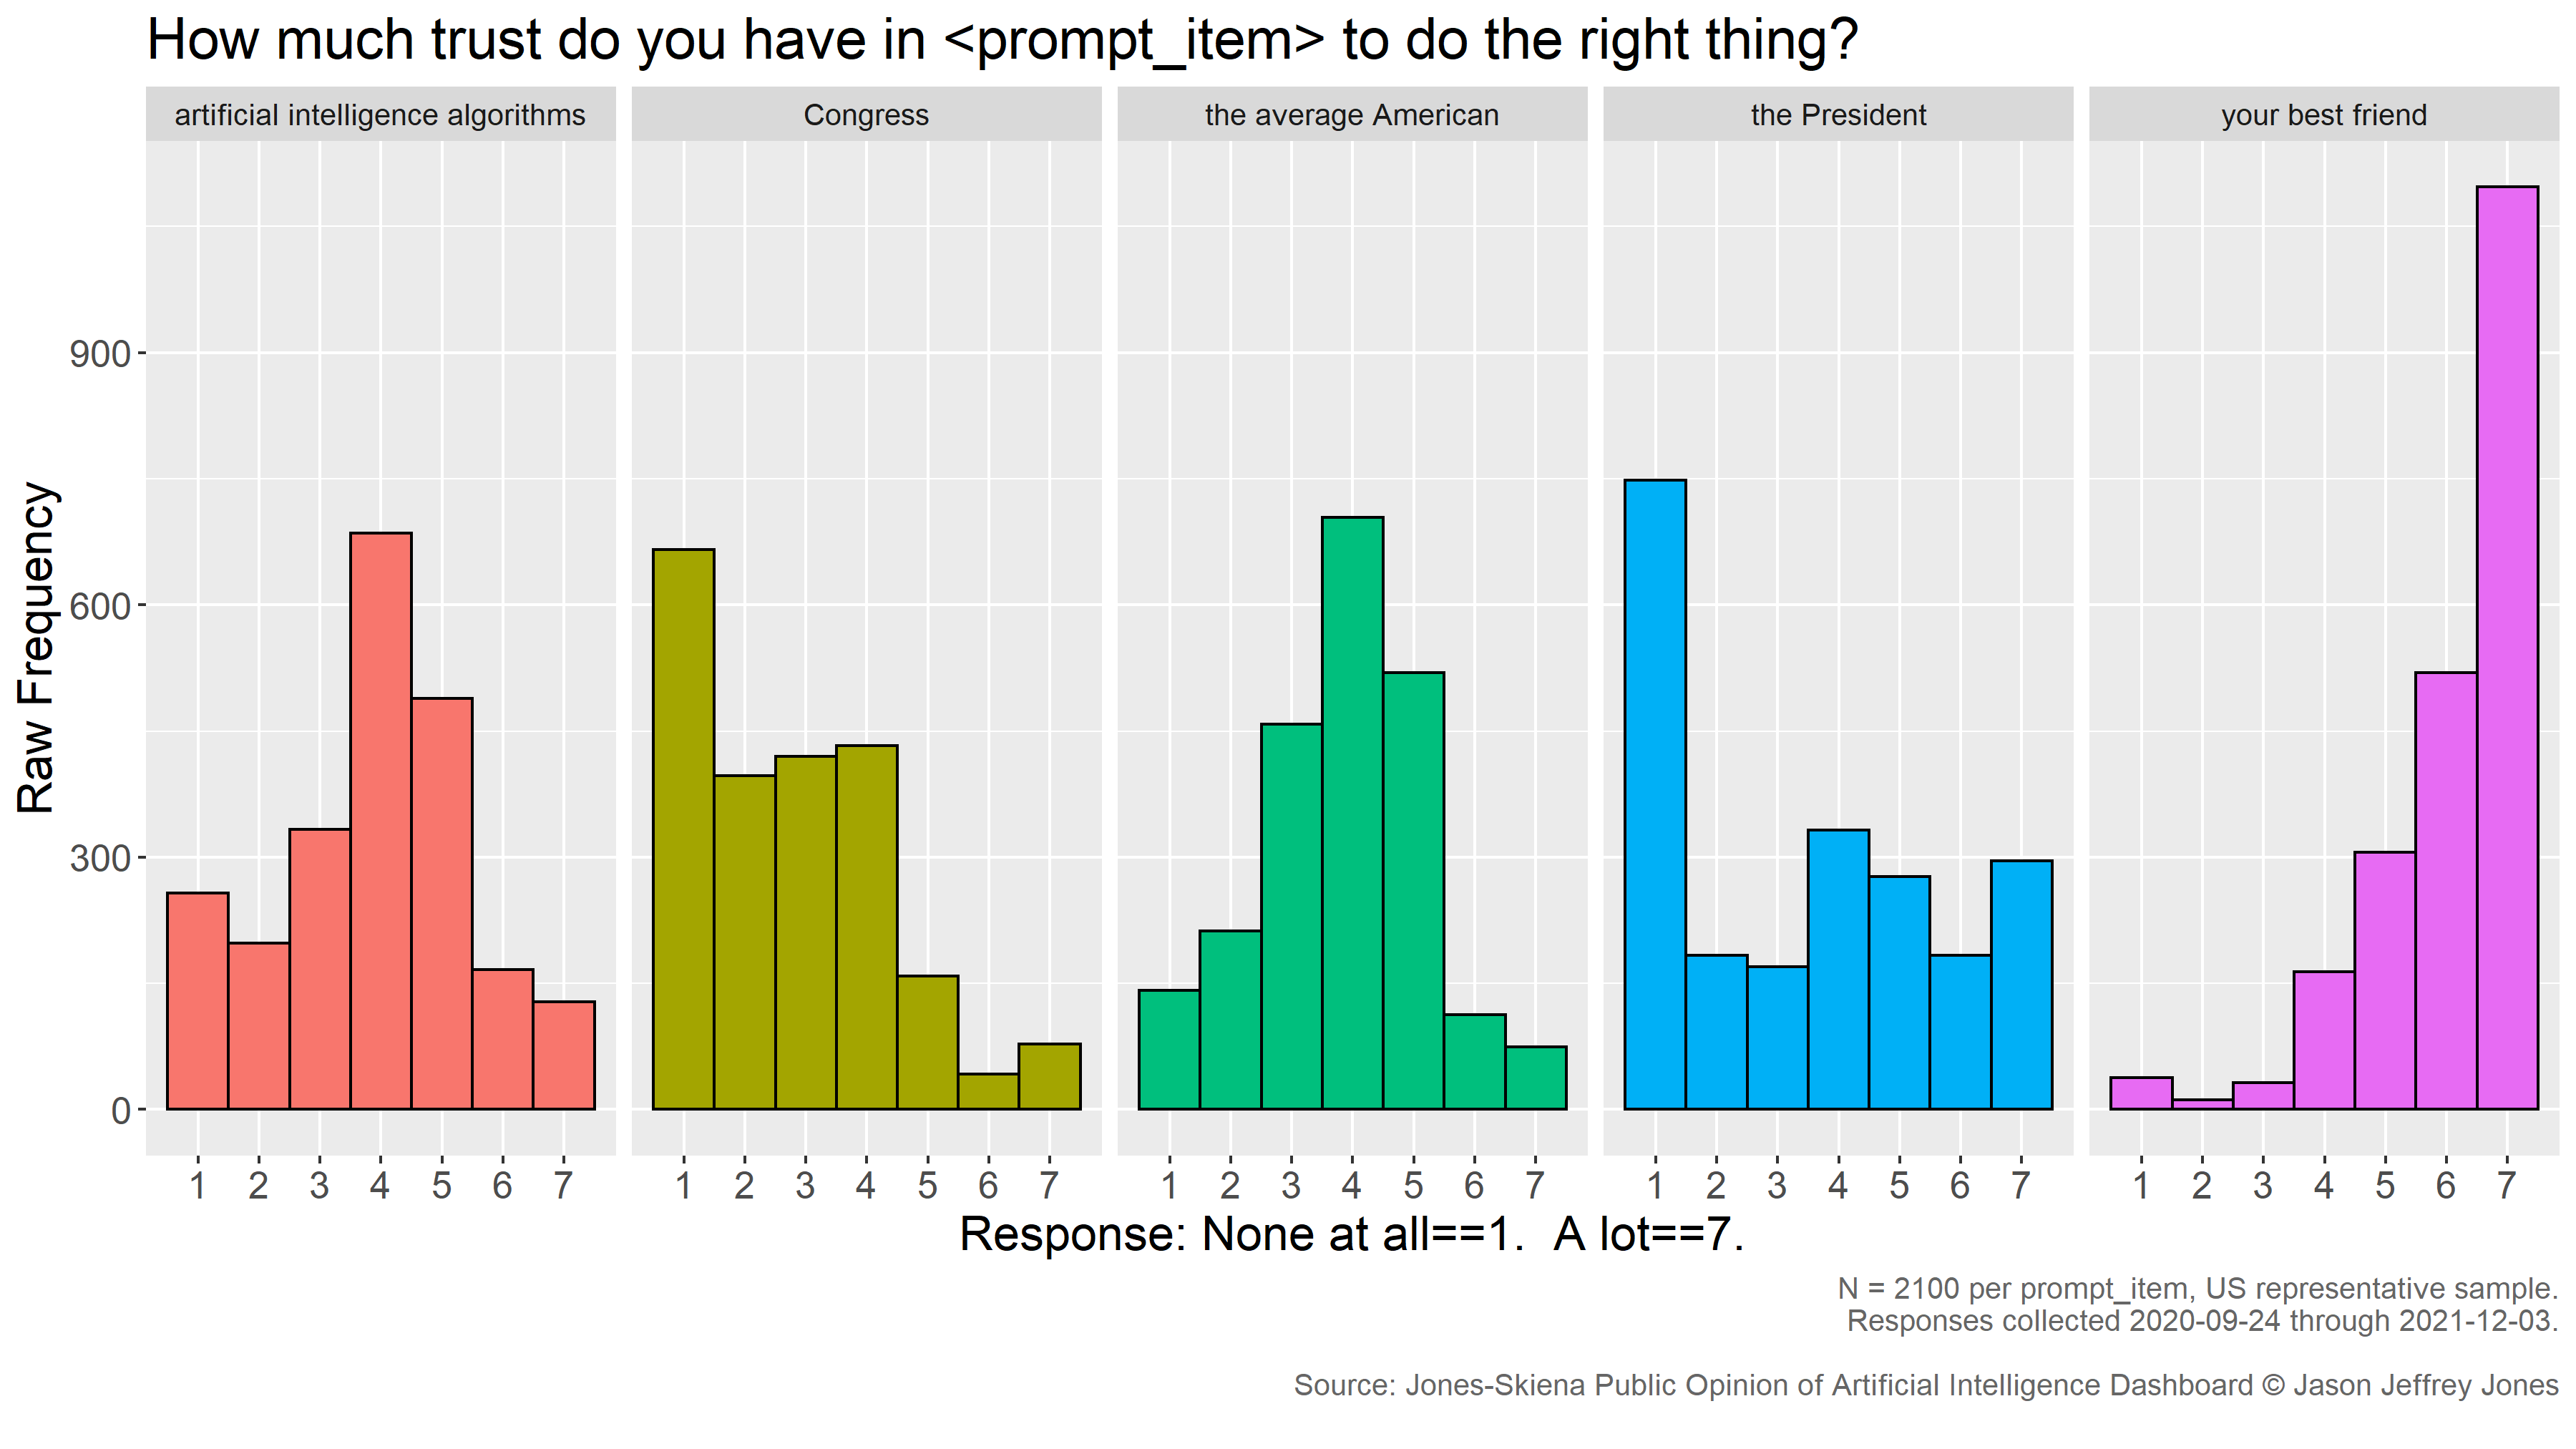
How much trust do you have in <prompt-item> to do the right thing?
The mean response per week and linear trends are presented below.
Interpretation
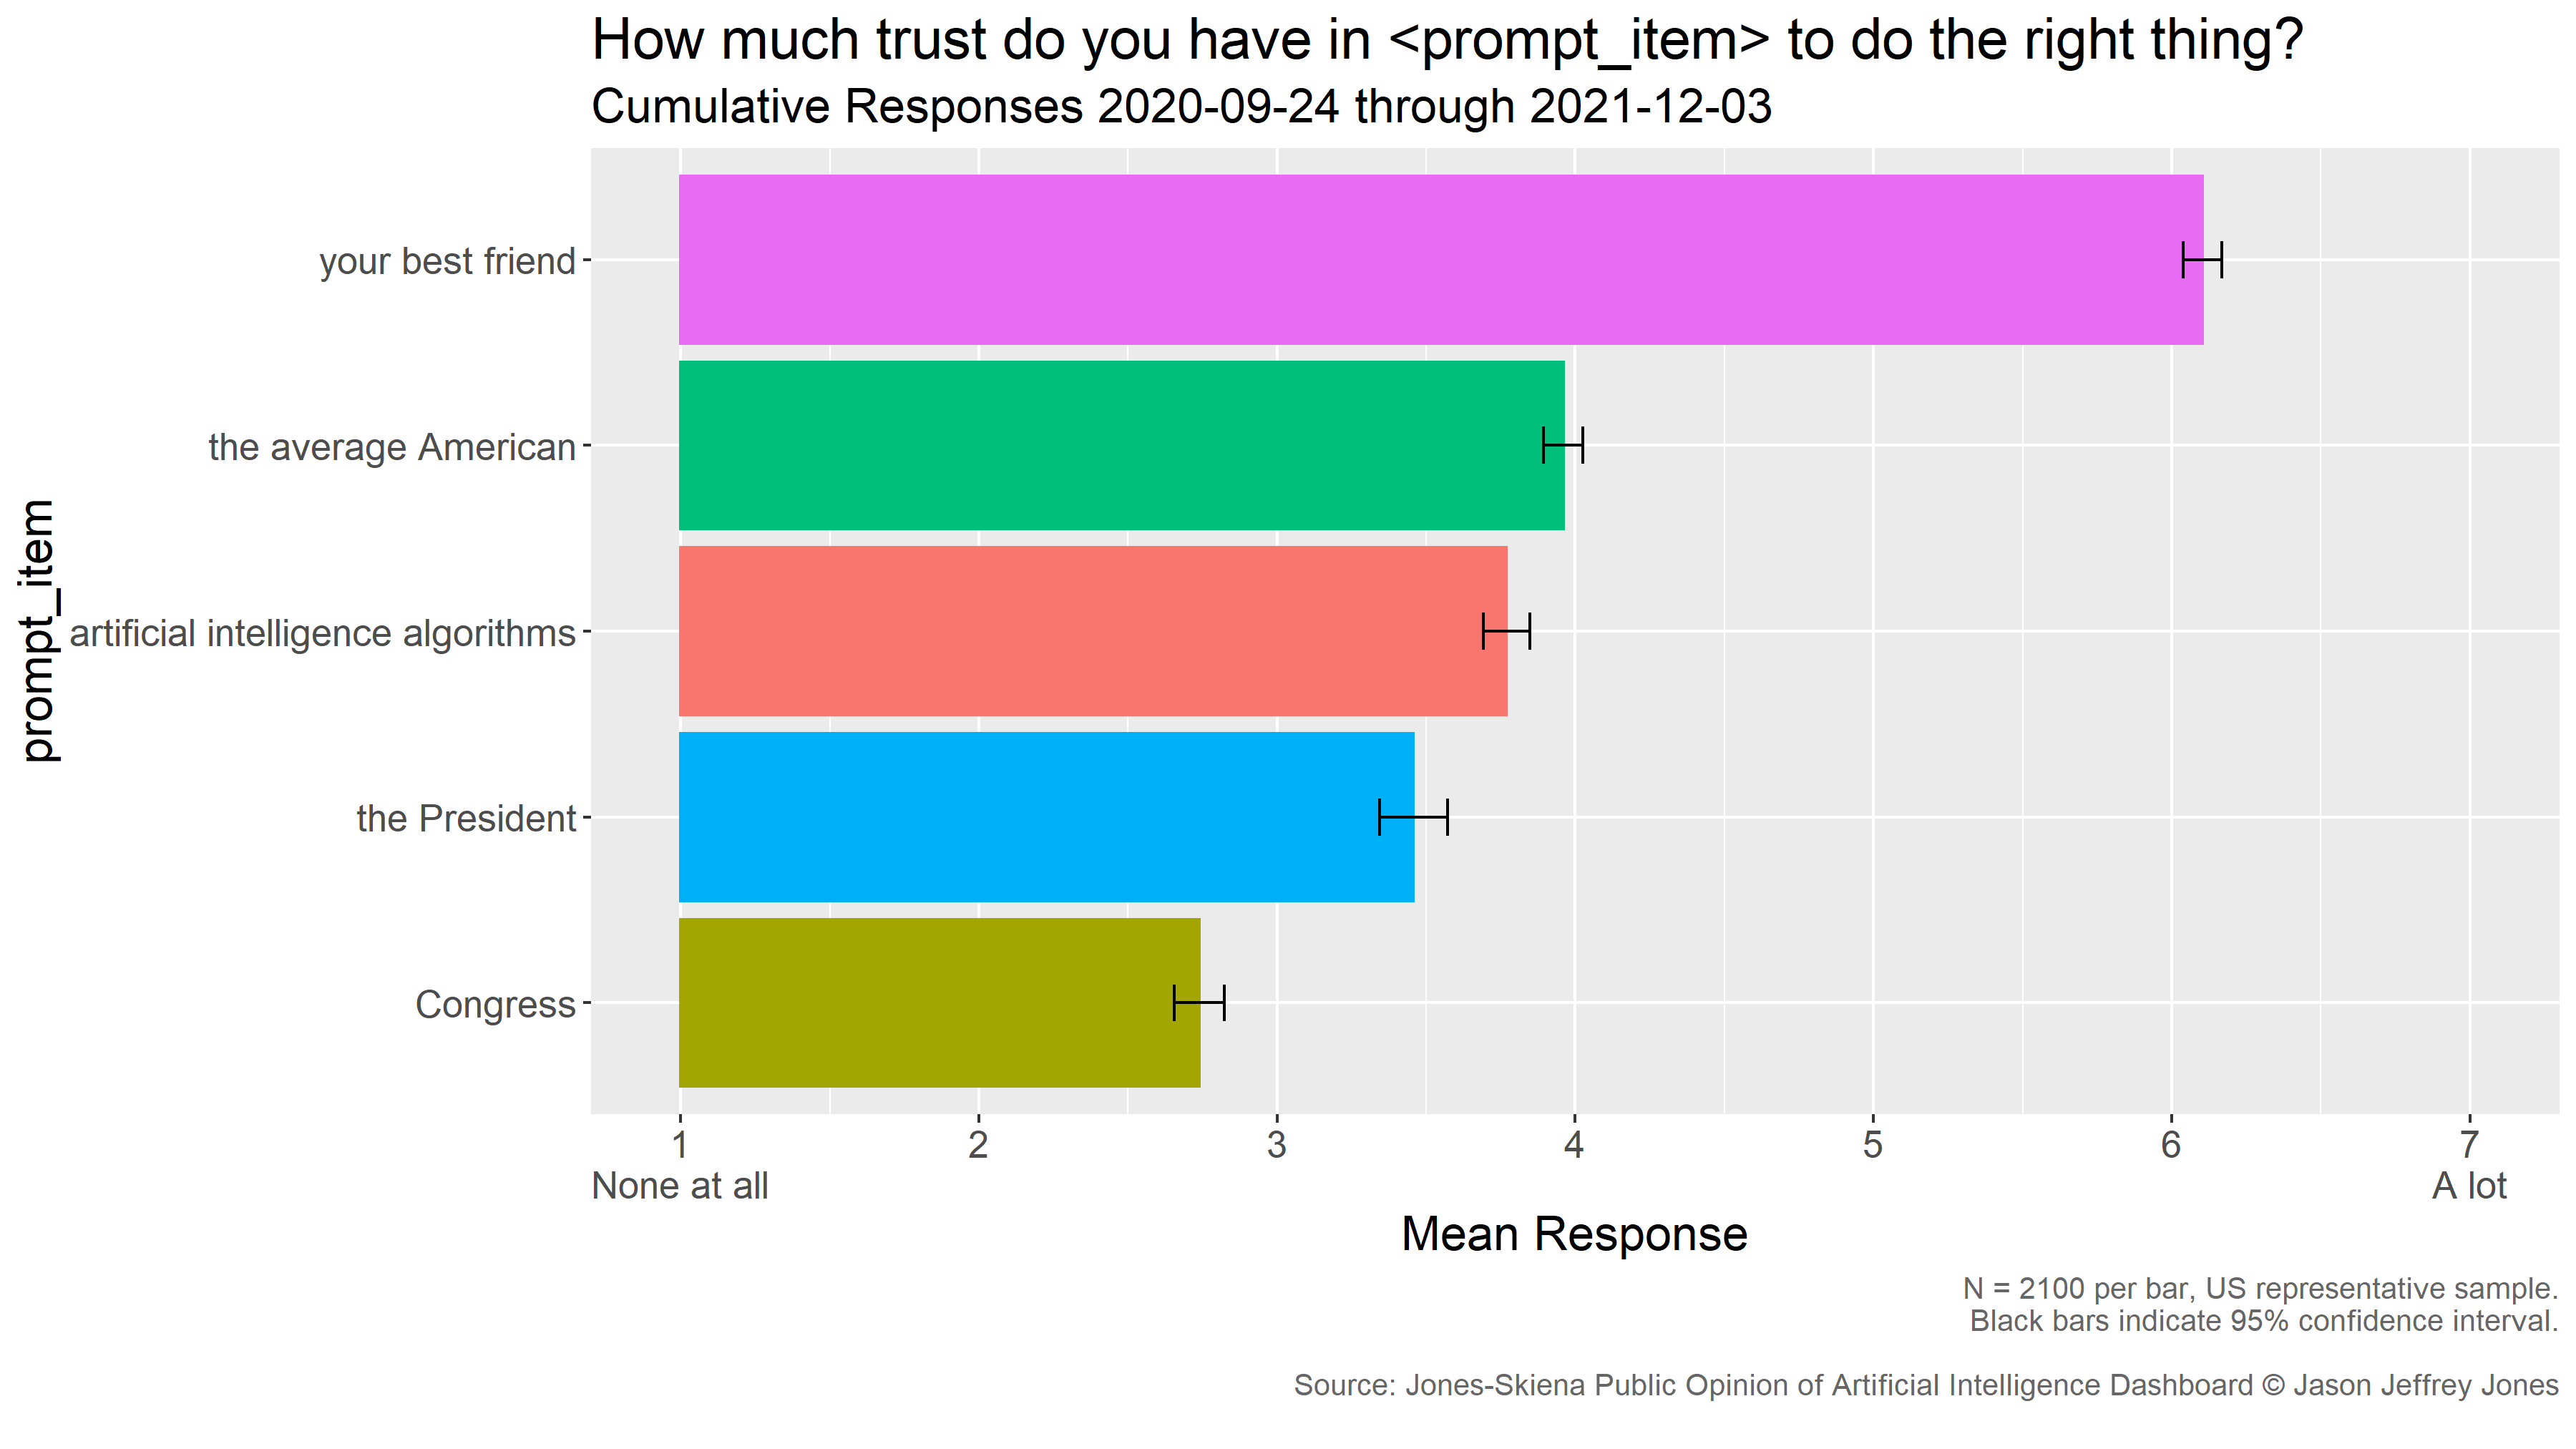
On average, the American public trusts "artificial intelligence algorithms" to do the right thing just a little less than they trust the average American. Americans trust artificial intelligence algorithms more than Congress or the President, but not as much as their best friend. Pooling the data and weighting to match demographics, we may estimate the following 95% confidence intervals.
If you were thinking that these trust survey items would have interesting distributions, you'd be right.
During the period of observation, the magnitude and ordering of trust in these targets has remained stable. Trendlines are shown to aid the eye, but none have a slope significantly different from zero.
Confidence in Groups using Artificial Intelligence
NEW DATA! Updated 2021-12-22.
We deliver items of the following form every month to a random, representative sample of 100 Americans:
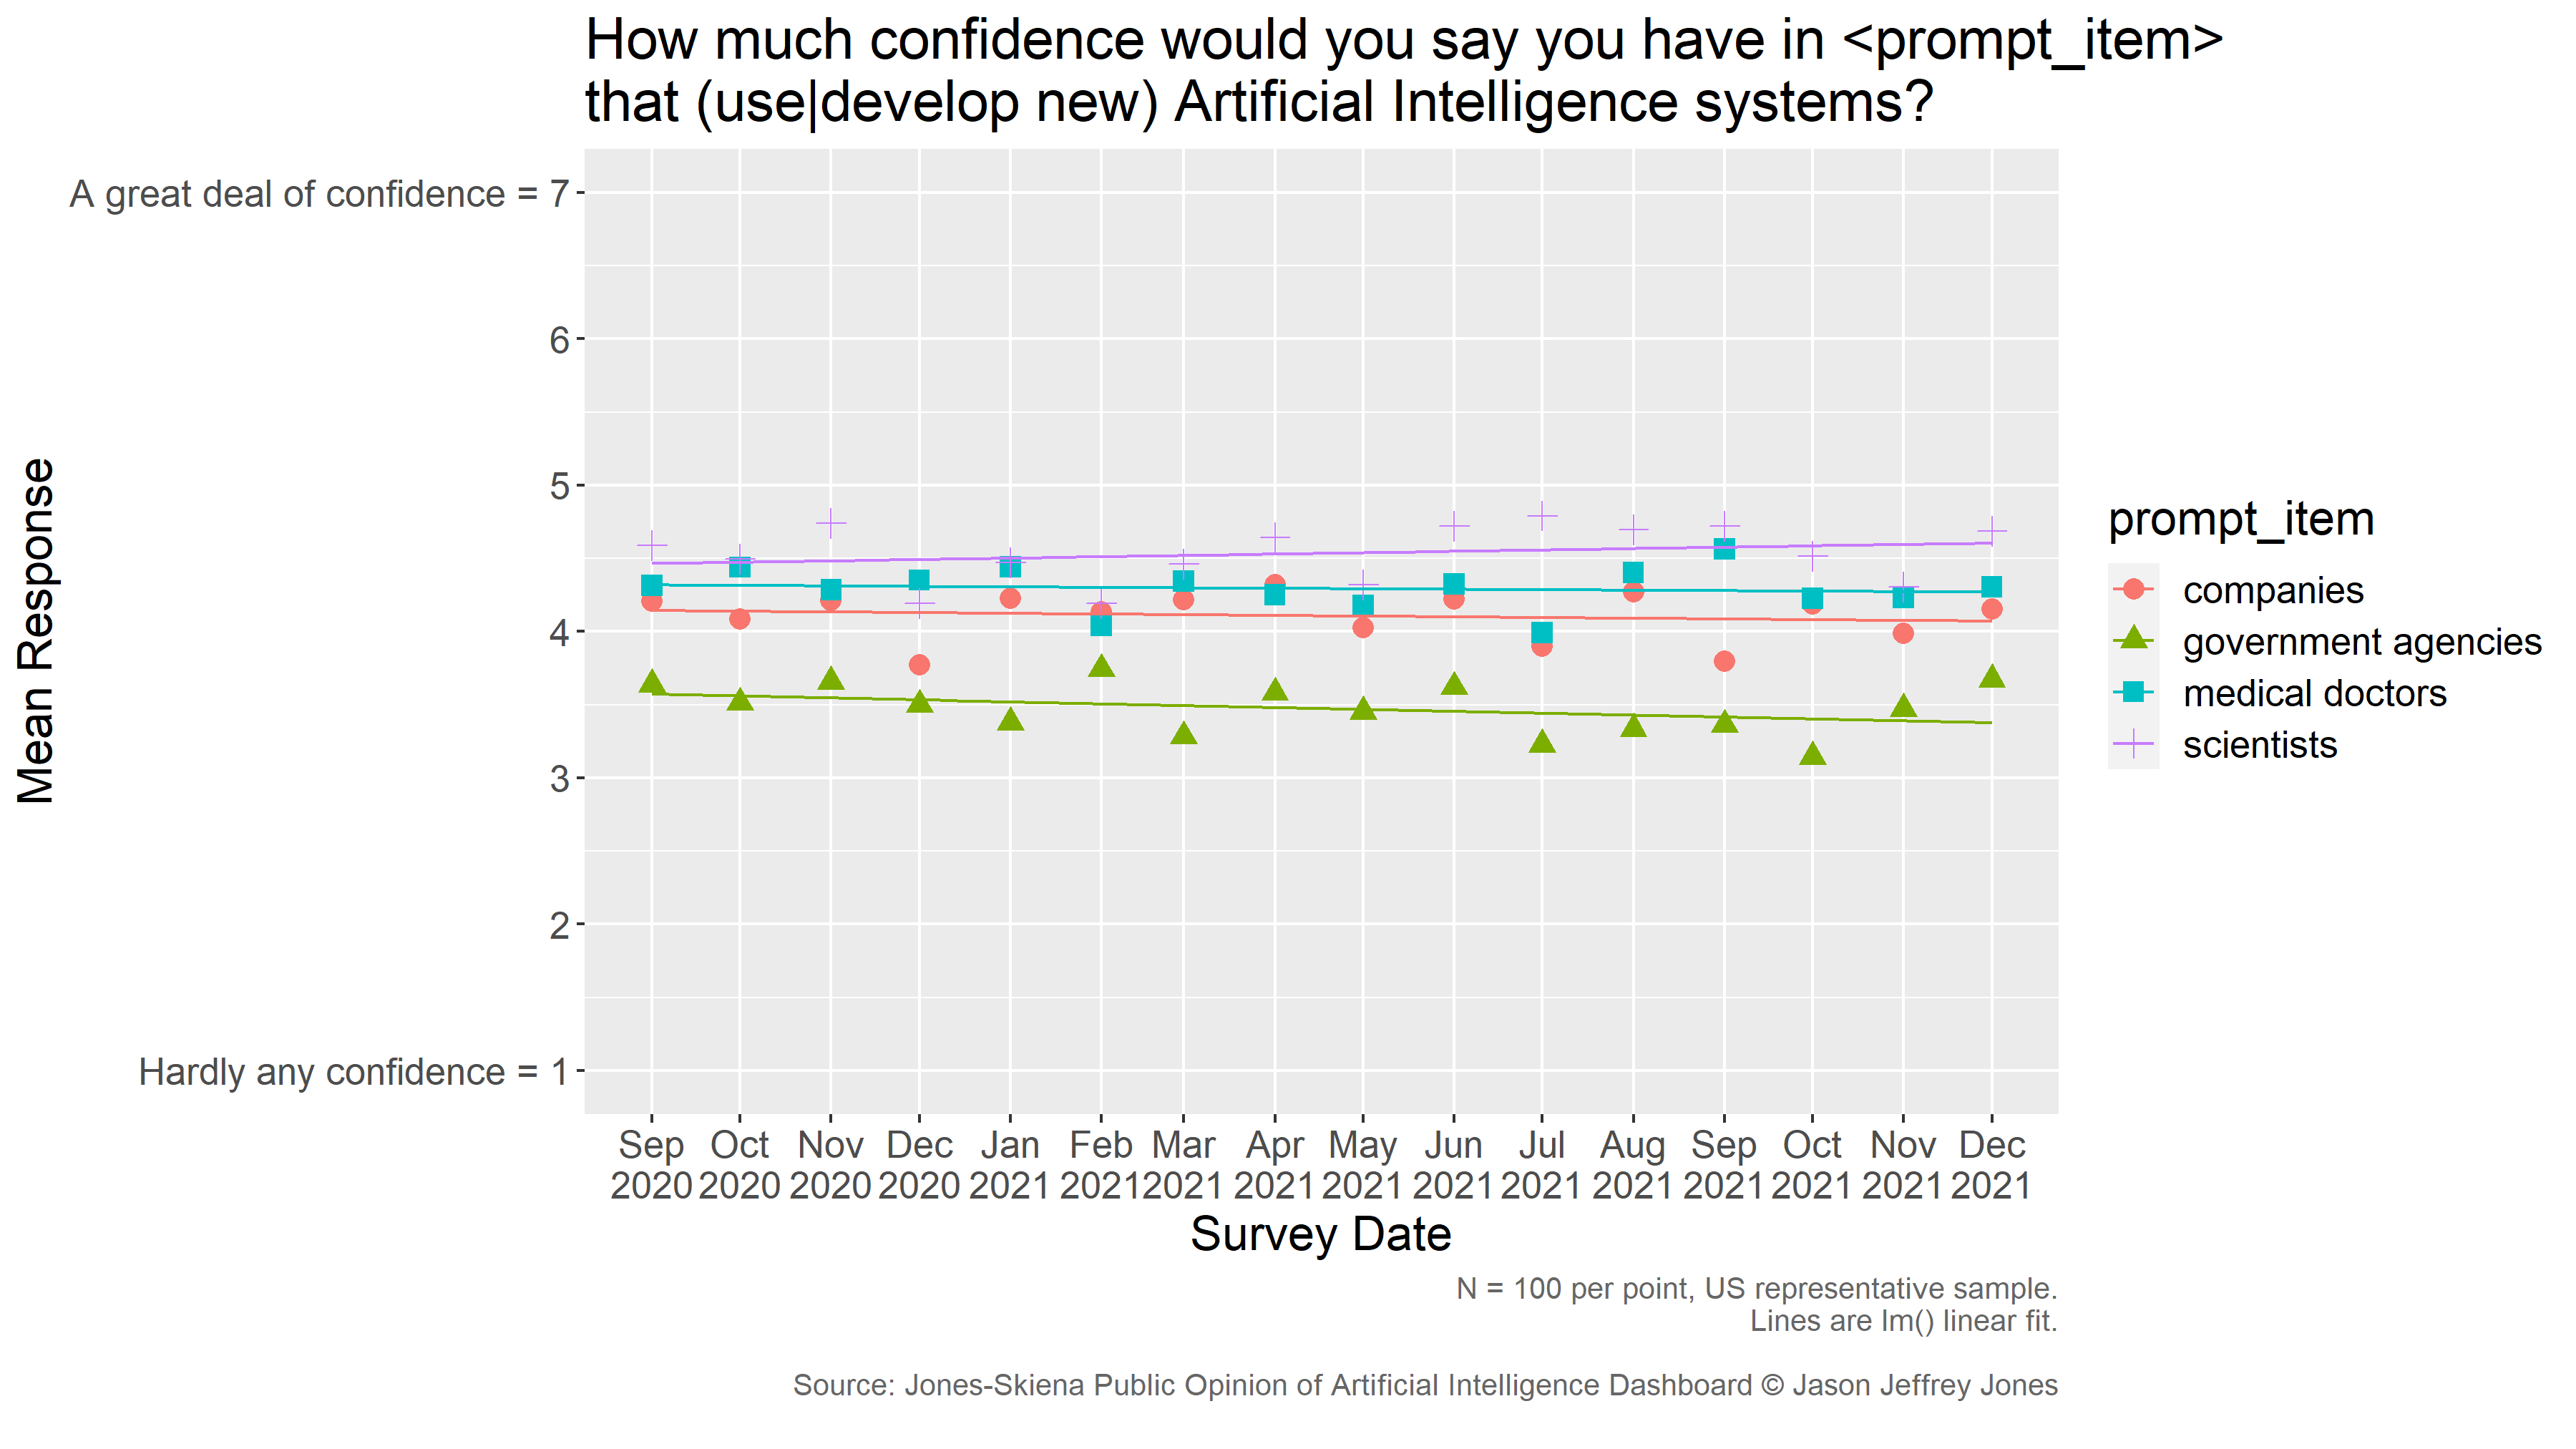
How much confidence would you say you have in <prompt-items> that use Artificial Intelligence systems?
The mean response per month and a linear trend are presented below.
Interpretation
On average, the American public has middling confidence in groups that use Artificial Intelligence. There is plenty of room on the scale for respondents to indicate they have less confidence or more, but the responses point to sustained intermediate levels of confidence, or perhaps indifference. Trendlines are shown to aid the eye, but none have a slope significantly different from zero.
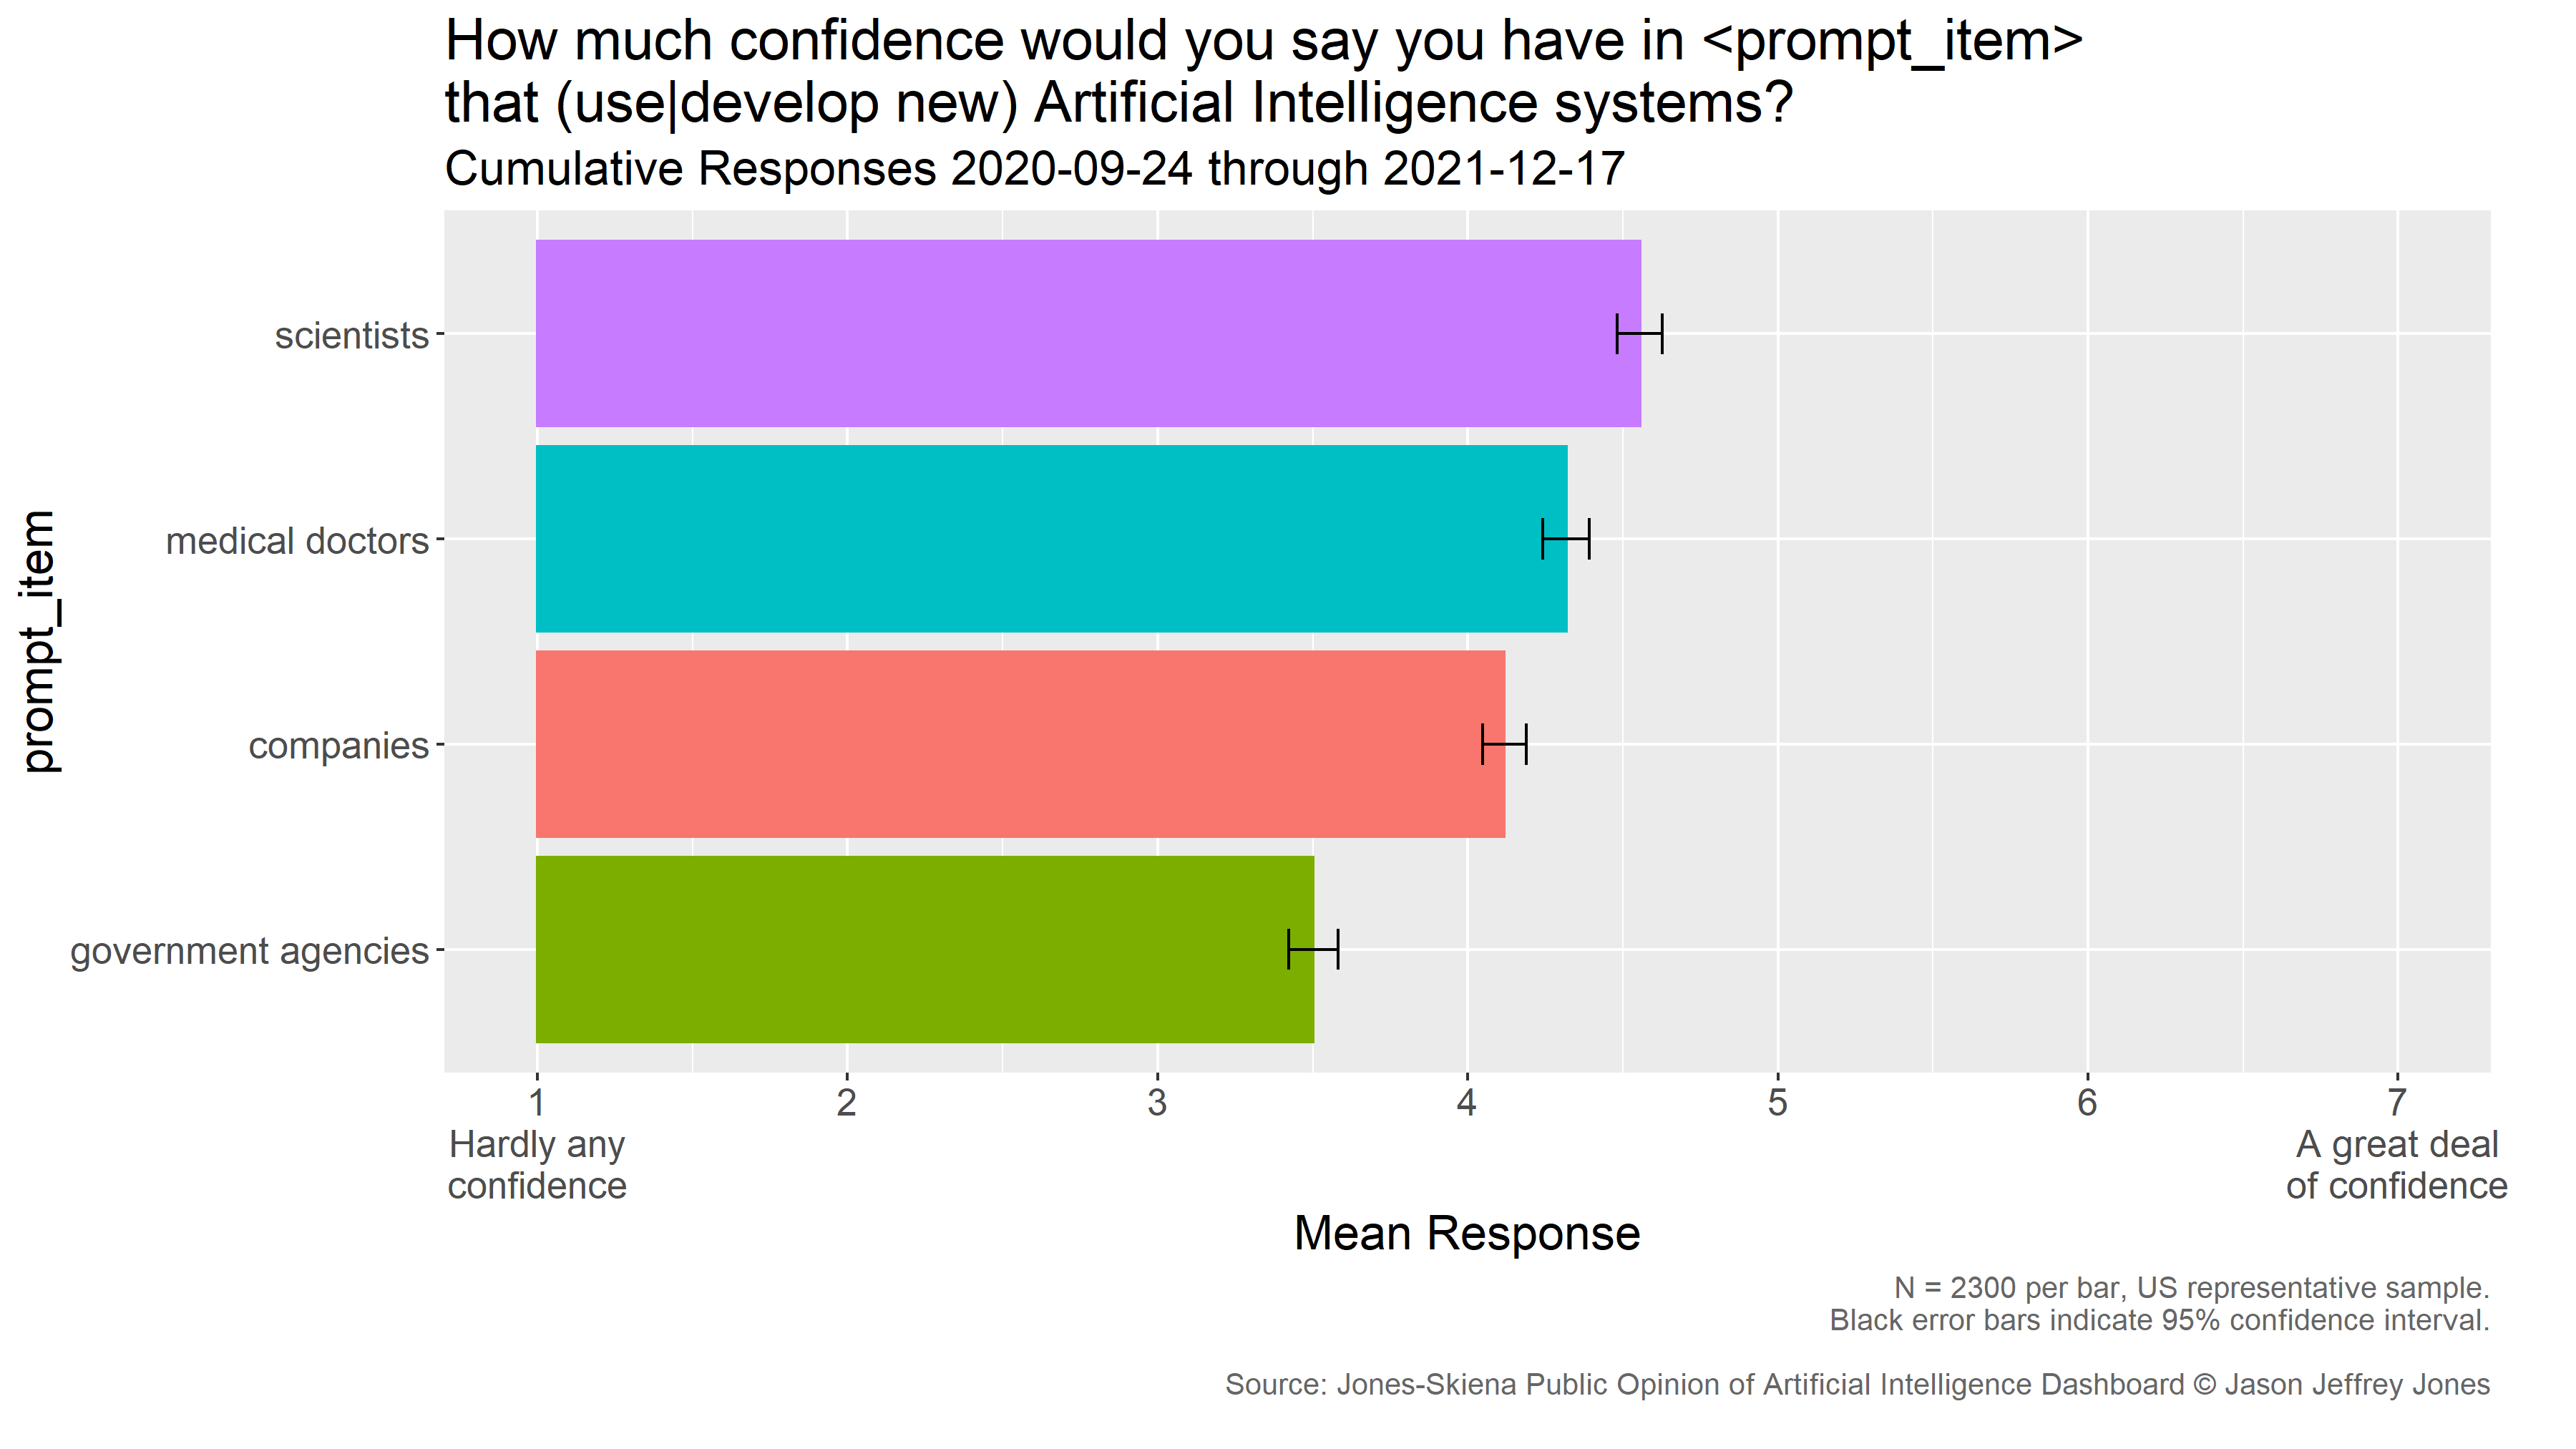
The figure below contrasts the means for each prompt item, collapsing across all dates. Overall, Americans place highest confidence in scientists to develop new artificial intelligence systems, followed by medical doctors, companies and government agencies to use these systems.
Familiarity with Artificial Intelligence
NEW DATA! Updated 2021-12-22.
We deliver items of the following form every month to a random, representative sample of 100 Americans:
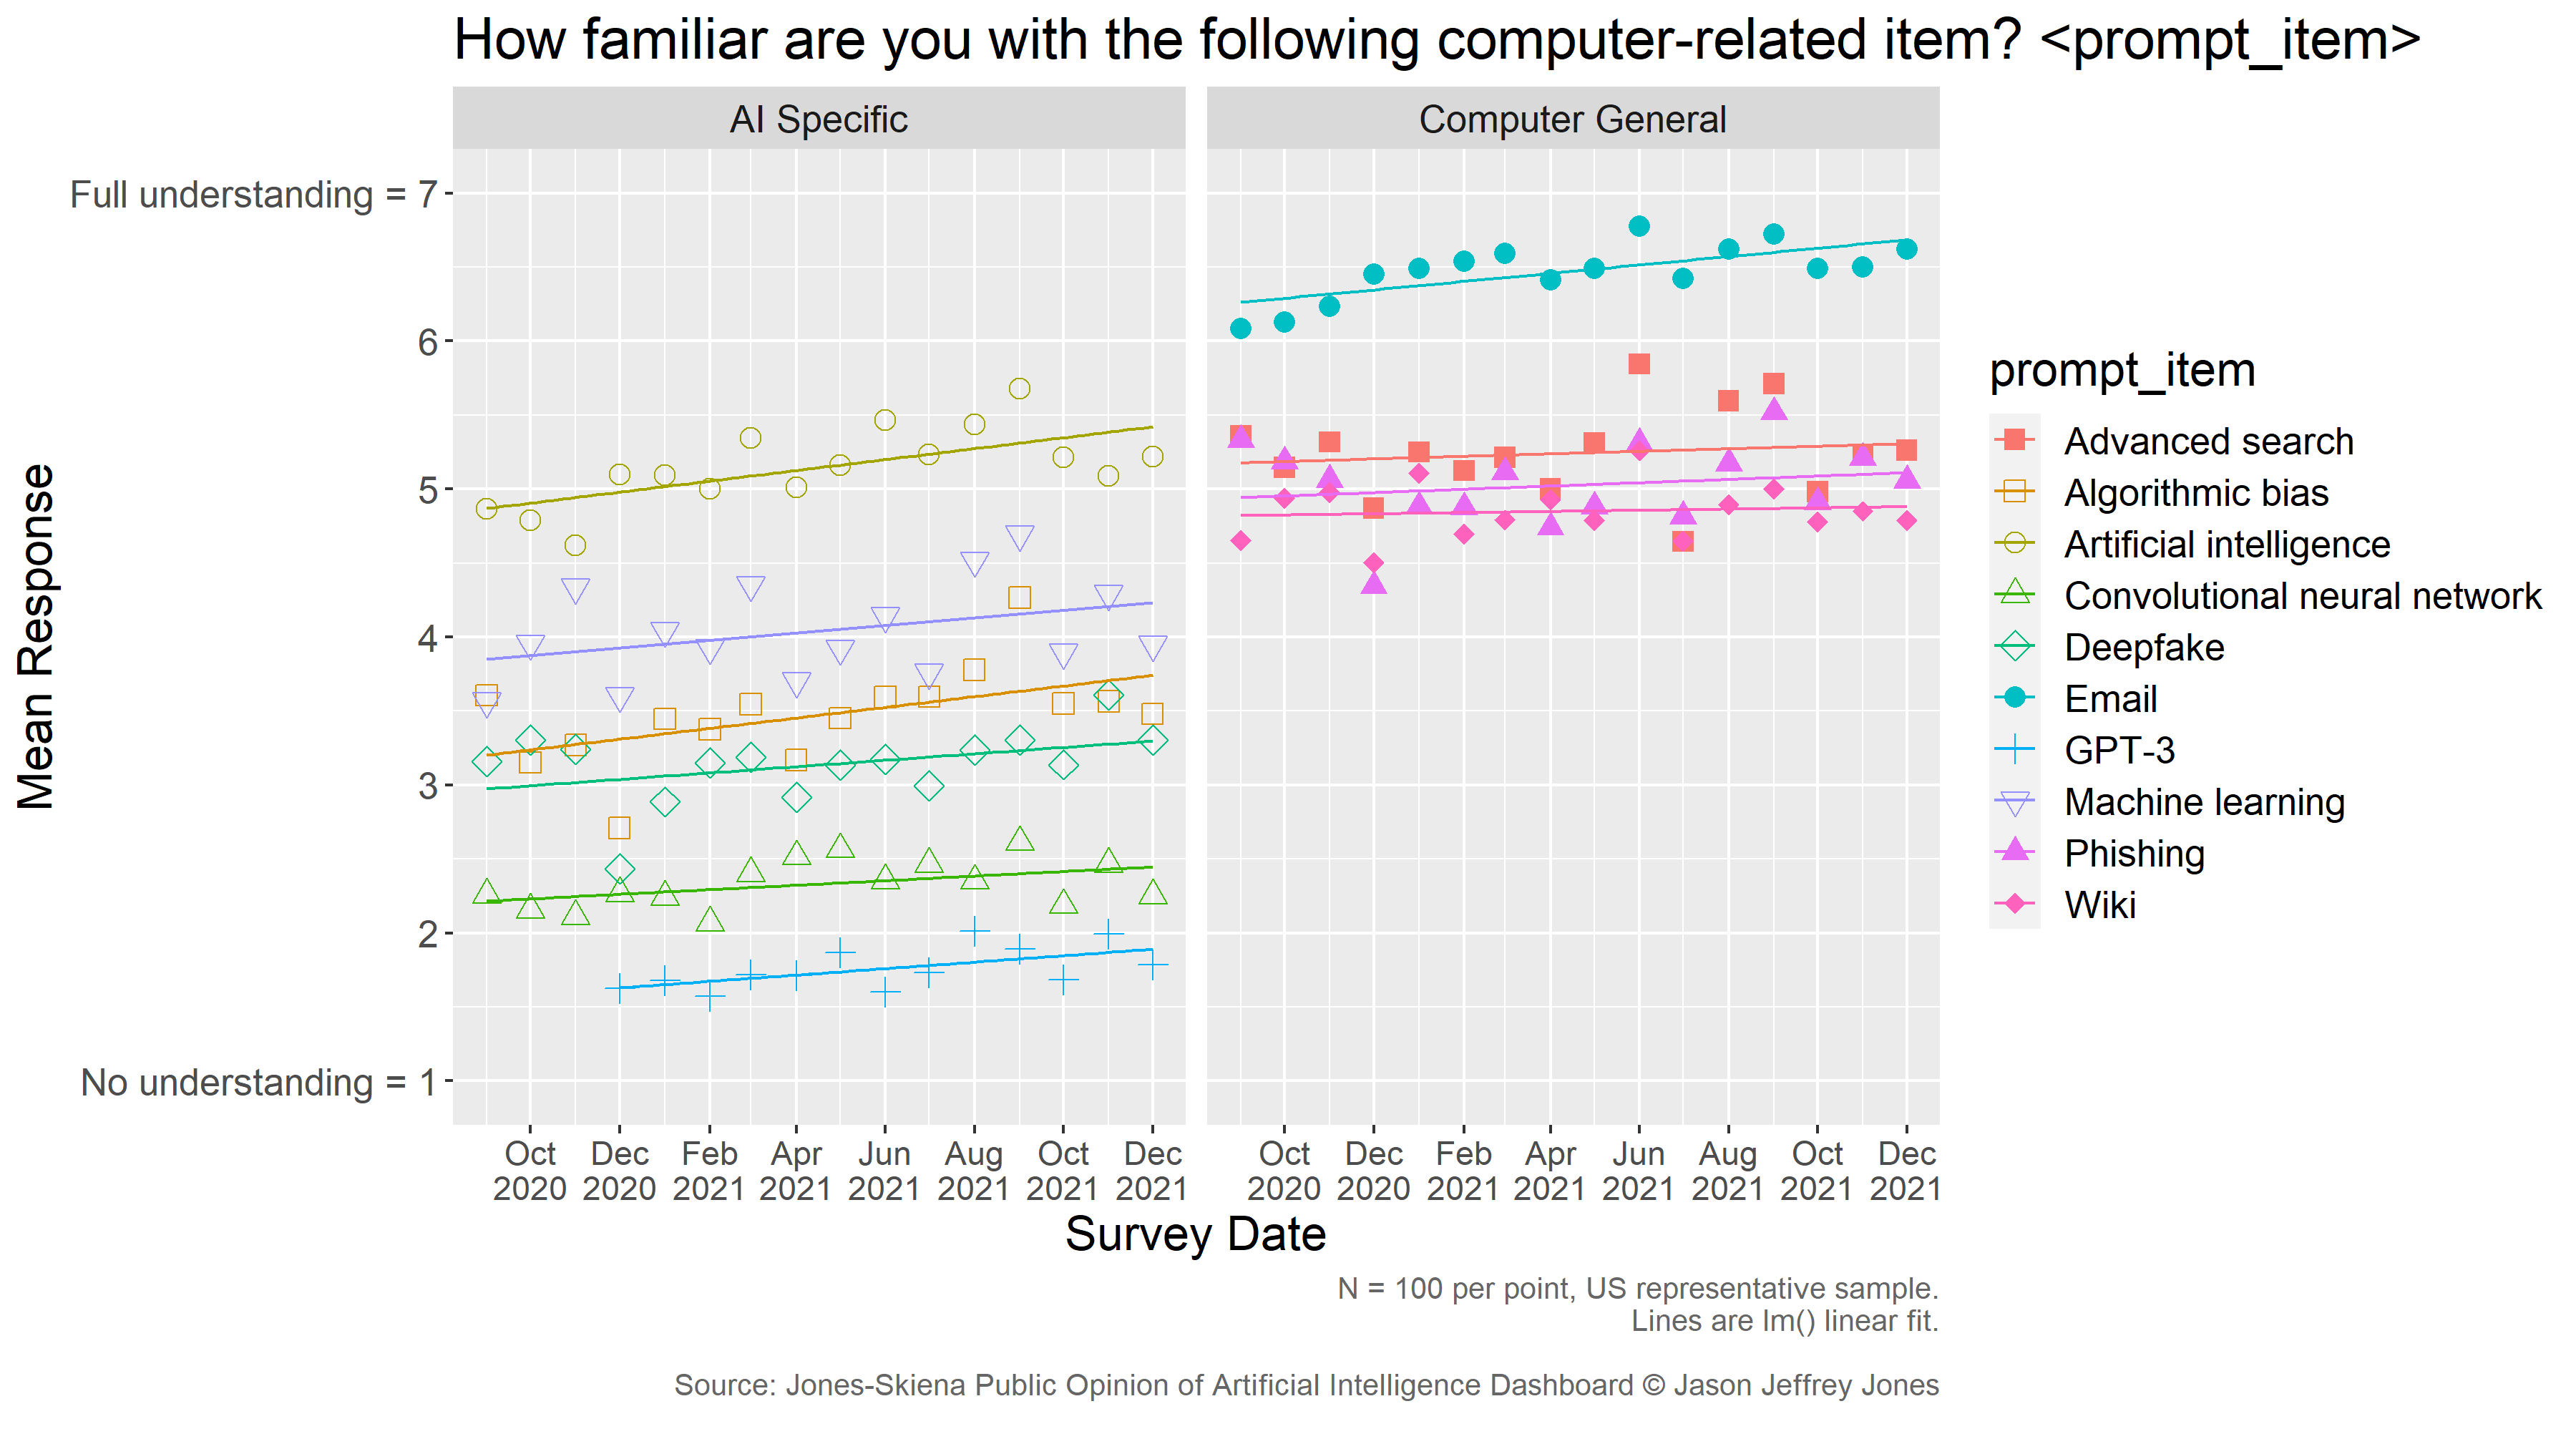
How familiar are you with the following computer-related item? <prompt-item>
The mean response per month and a linear trend are presented below.
Interpretation
Over the past year, self-reported understanding of the following items has increased: "Artificial intelligence," "Algorithmic bias," and "Convolutional neural network."
Are Americans really still on the learning curve for email? It is hard to believe, but that is what the data say. The positive slope of the regression line is statistically significant for Email, p < 0.001.
On average, the American public self-reports less understanding of Artificial Intellgience terms as compared to other computer terms. That split is apparent by the separation of the datapoints and trendlines above. It can be seen more clearly in the following visualization which pools the data for all survey rounds and estimates 95% confidence intervals for each item.
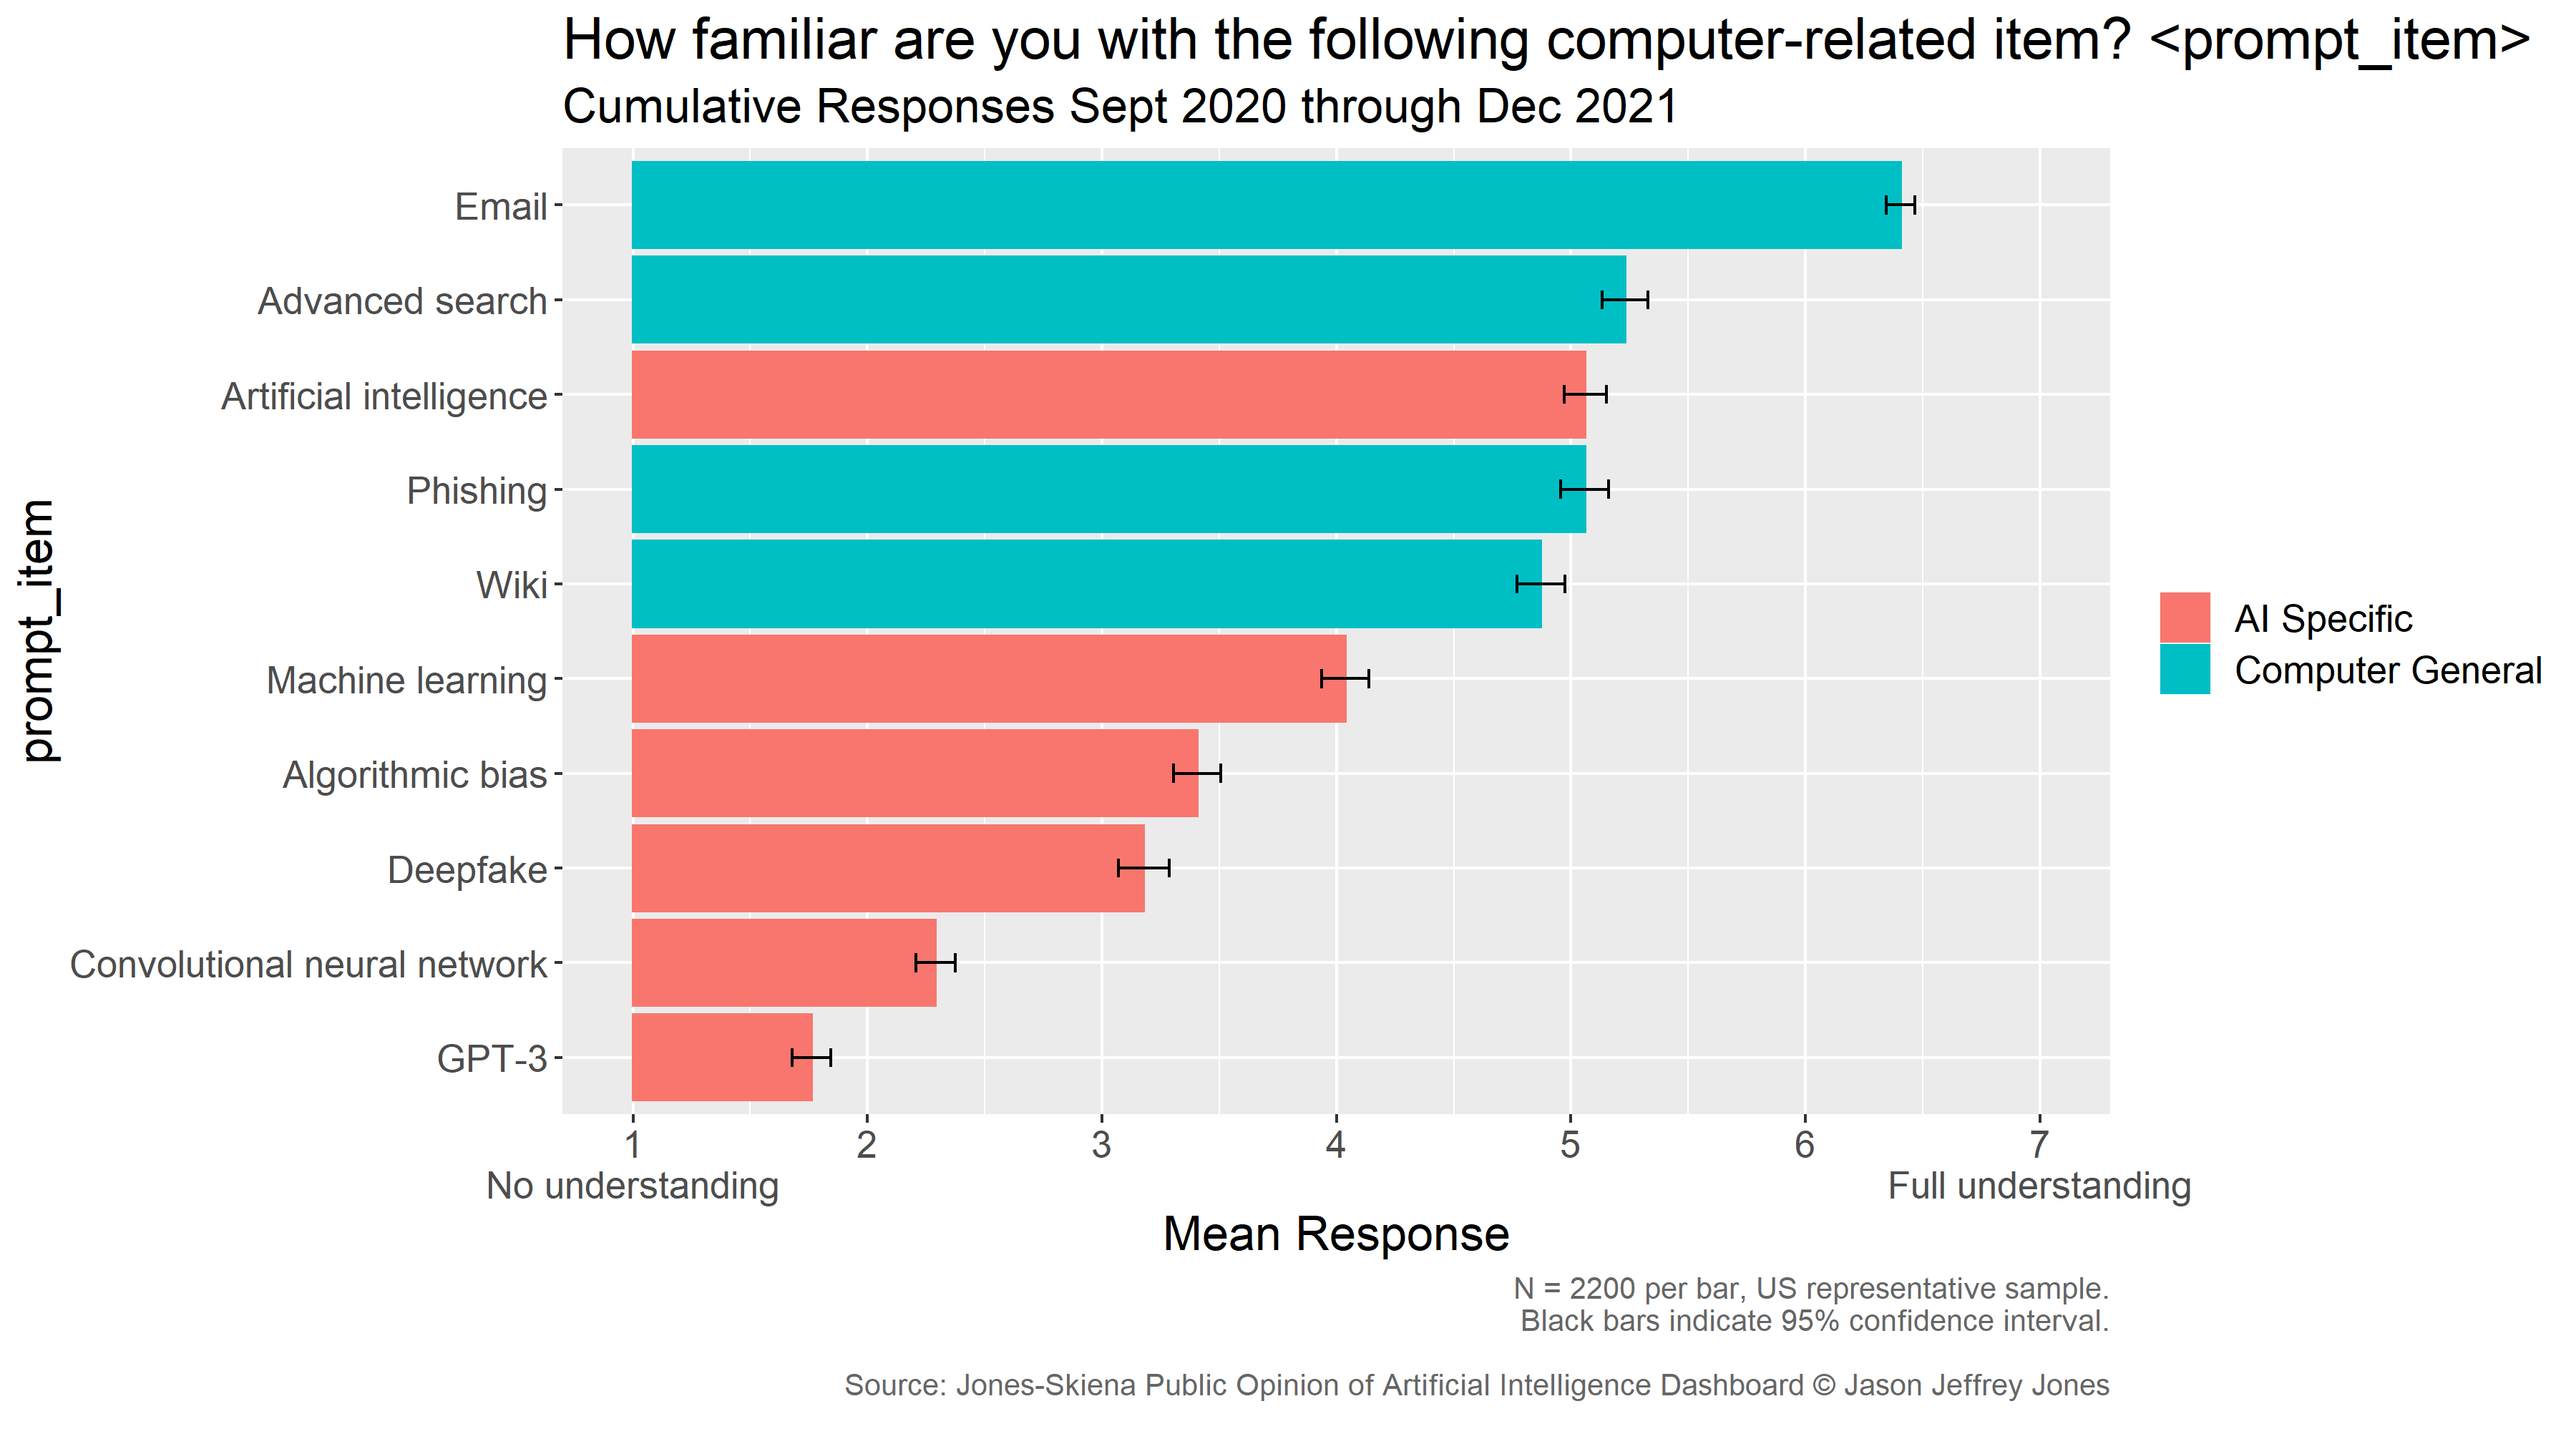
Americans report very low understanding of 'GPT-3'. The estimate appears to be trending upward, but is still the lowest of all prompt items.
One-Time Special Topic Surveys
Updated 2021-05-03.
From time to time, we run a one-time survey on a special topic. You can request an item or topic by contacting Dr. Jones.
Americans' Attitudes Toward Artificial General Intelligence (AGI)
- The aim of this survey was to estimate Americans' attitudes and beliefs regarding Artificial General Intelligence.
- Example Item - How much do you agree: If scientists determine AGI can be built, it should be built.
Contextualizing Support for AI Development
- The aim of this survey was to contrast opposition to and support for the development of AI to opposition and support of other technologies.
- It is useful to compare the results to our weekly Support for the Development of Artificial Intelligence survey results. We estimate support among the US adult population and subpopulations of gender and age.
- Example Item - How much do you oppose or support the development of space exploration technology?
AI Fear Scenarios Survey
- Ten items measuring the magnitude of fear Americans report for possible negative outcomes of AI
- Example Item - How much do you agree with this statement: I fear that Artificial Intelligence will lead to me losing my job involuntarily.
These surveys are conducted by Dr. Jason Jeffrey Jones and Dr. Steven Sol Skiena. All raw data is available at this Open Science Foundation repository. Please include proper attribution any time you make use of our work. Read more about the Jones-Skiena Public Opinion of AI Dashboard.