Jones-Skiena Public Opinion of Artificial Intelligence Dashboard
2020-11-23 Update
 -- Dr. Jason Jeffrey Jones -- @jasonjones_jjj
 -- Dr. Steven Sol Skiena -- @stevenskiena
Support for the Development of Artificial Intelligence
We deliver the following item every week to a random, representative sample of 100 Americans:
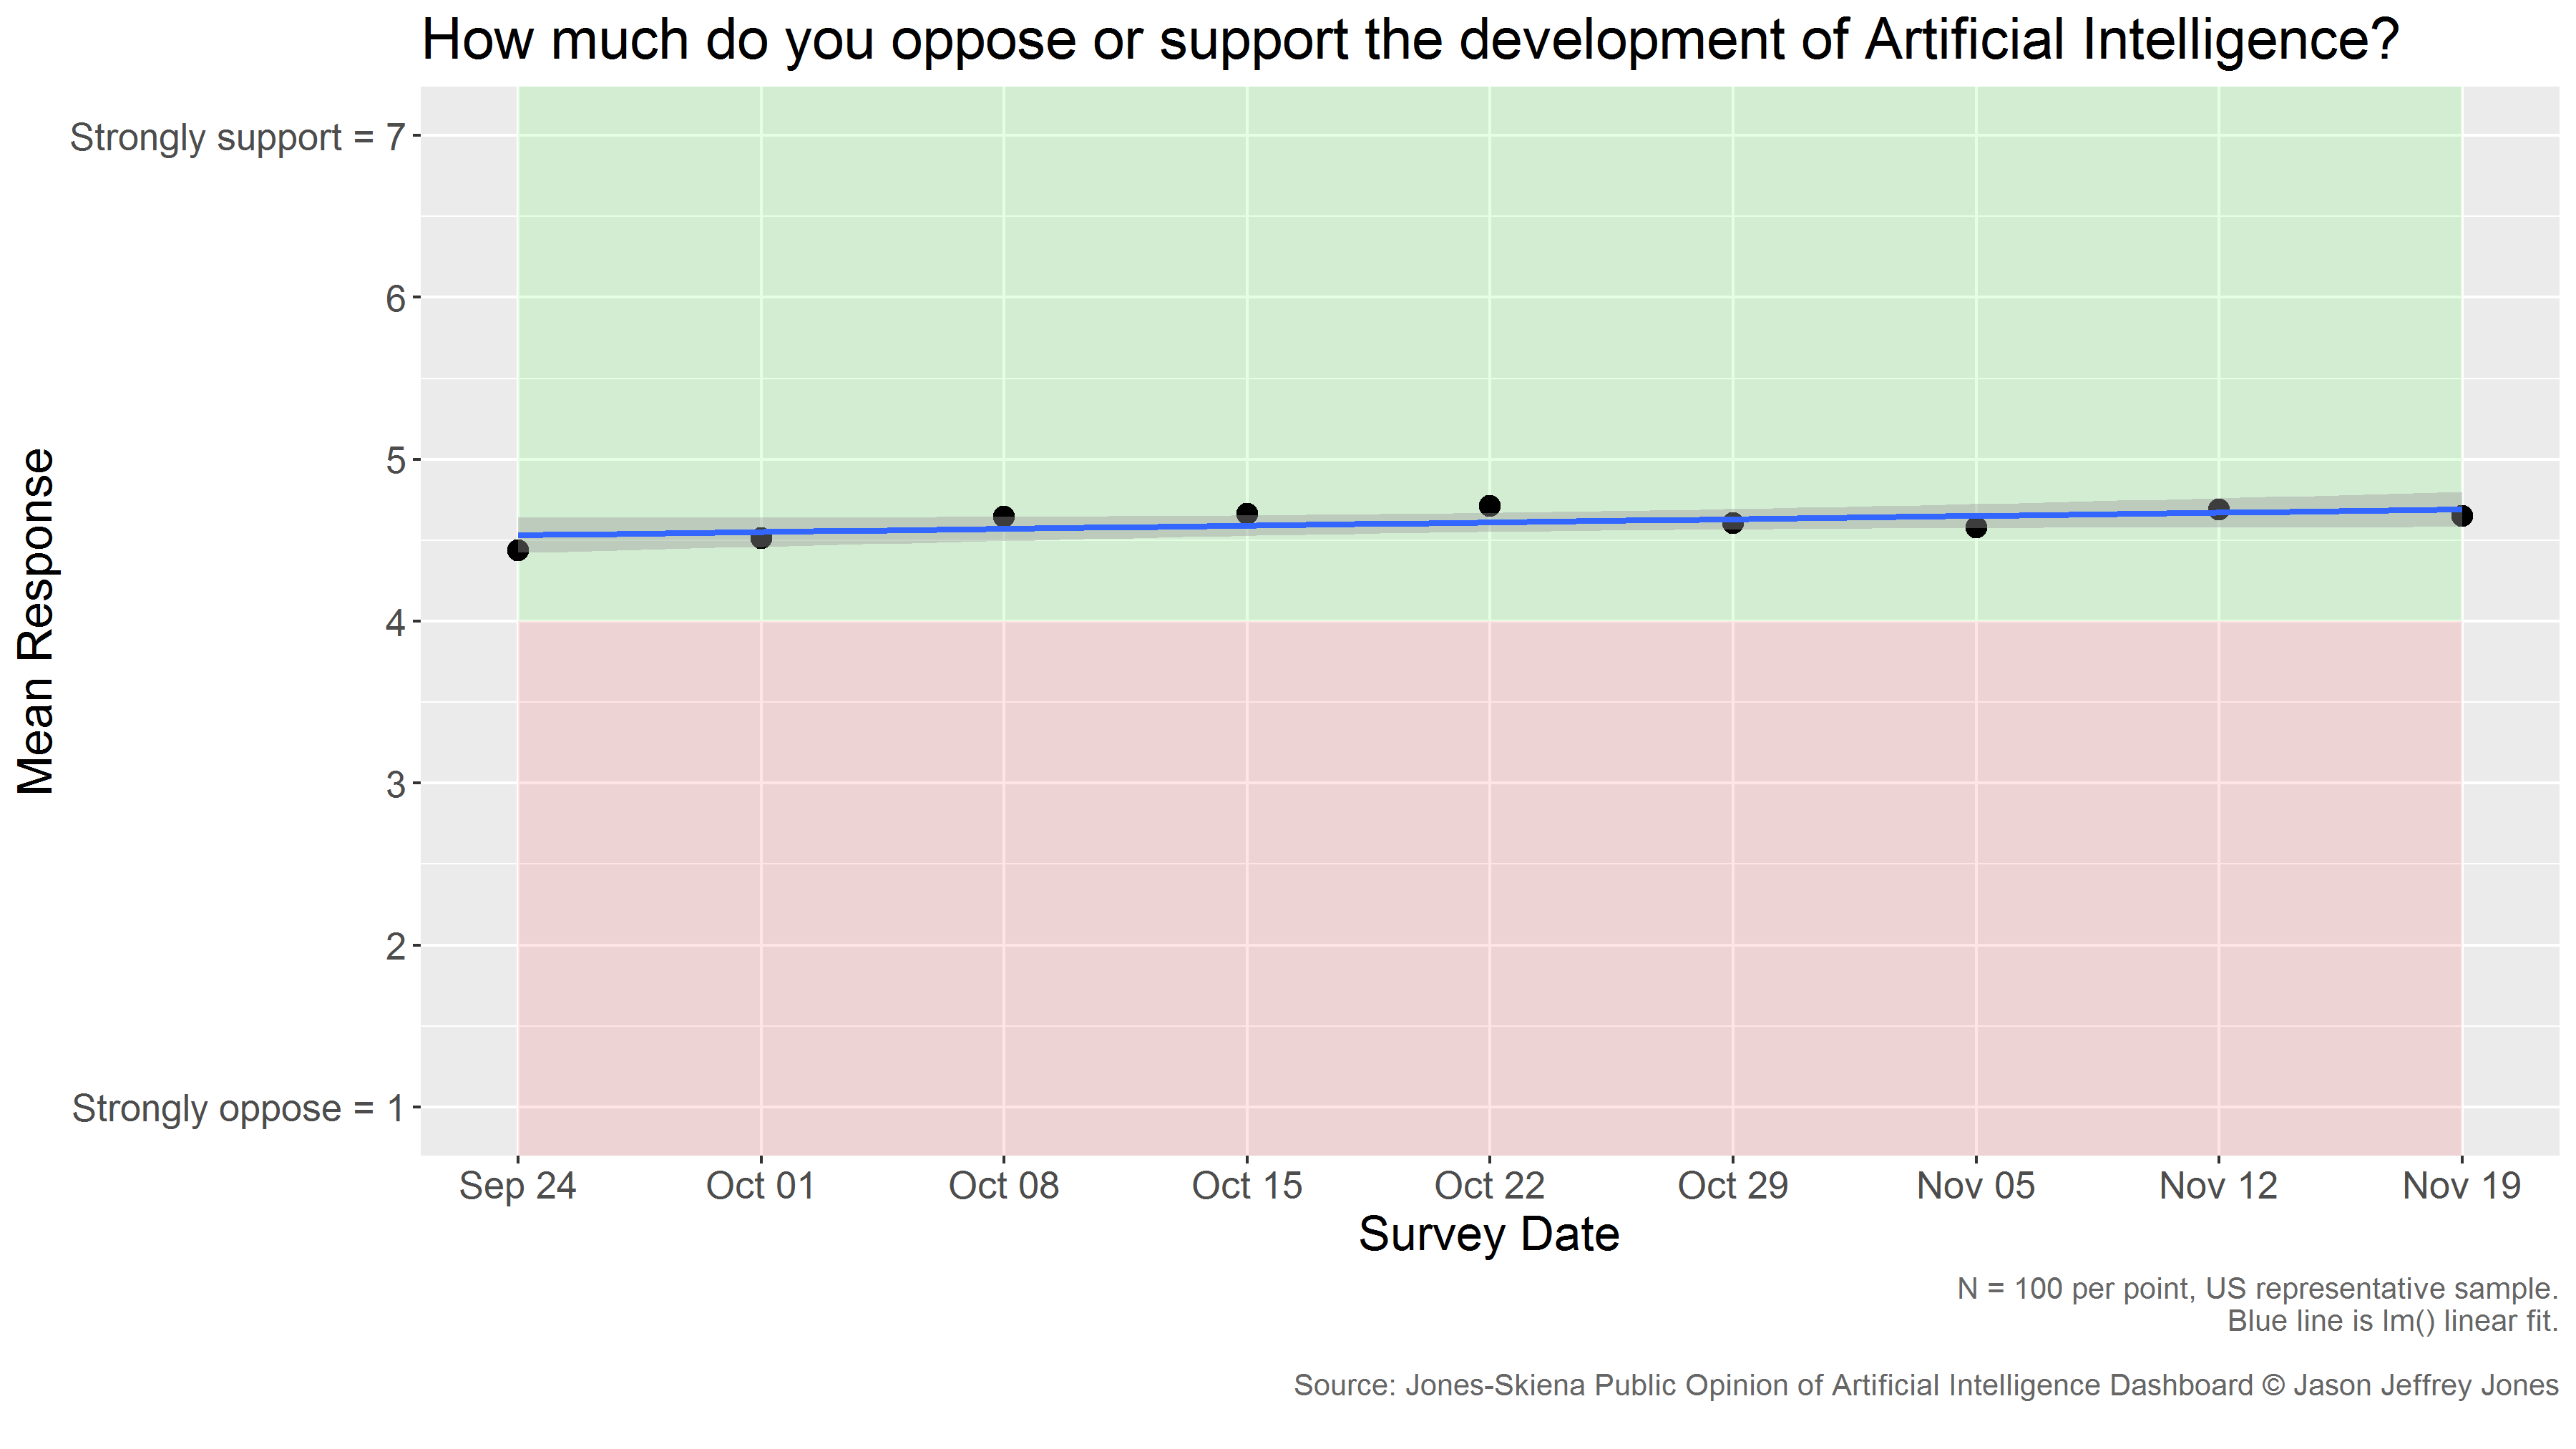
How much do you oppose or support the development of Artificial Intelligence?
The mean response per week and a linear trend are presented below.
Interpretation
On average, the American public supports the development of Artificial Intelligence. In the data from November 19, 2020, the estimated mean response is 4.65, with a 95% confidence interval of 4.27-5.03. On our 7-point scale (labeled "Strongly oppose" at one end and "Strongly support" at the other) a value of 4 indicates indifference, any value below that opposition and any point above support.
During the period of observation, support has remained stable. The mean estimate is remarkably consistent. The estimated slope of the trendline is not statistically significantly different from zero.
Confidence in Groups using Artificial Intelligence
NEW DATA! Updated 2020-11-23.
We deliver items of the following form every month to a random, representative sample of 100 Americans:
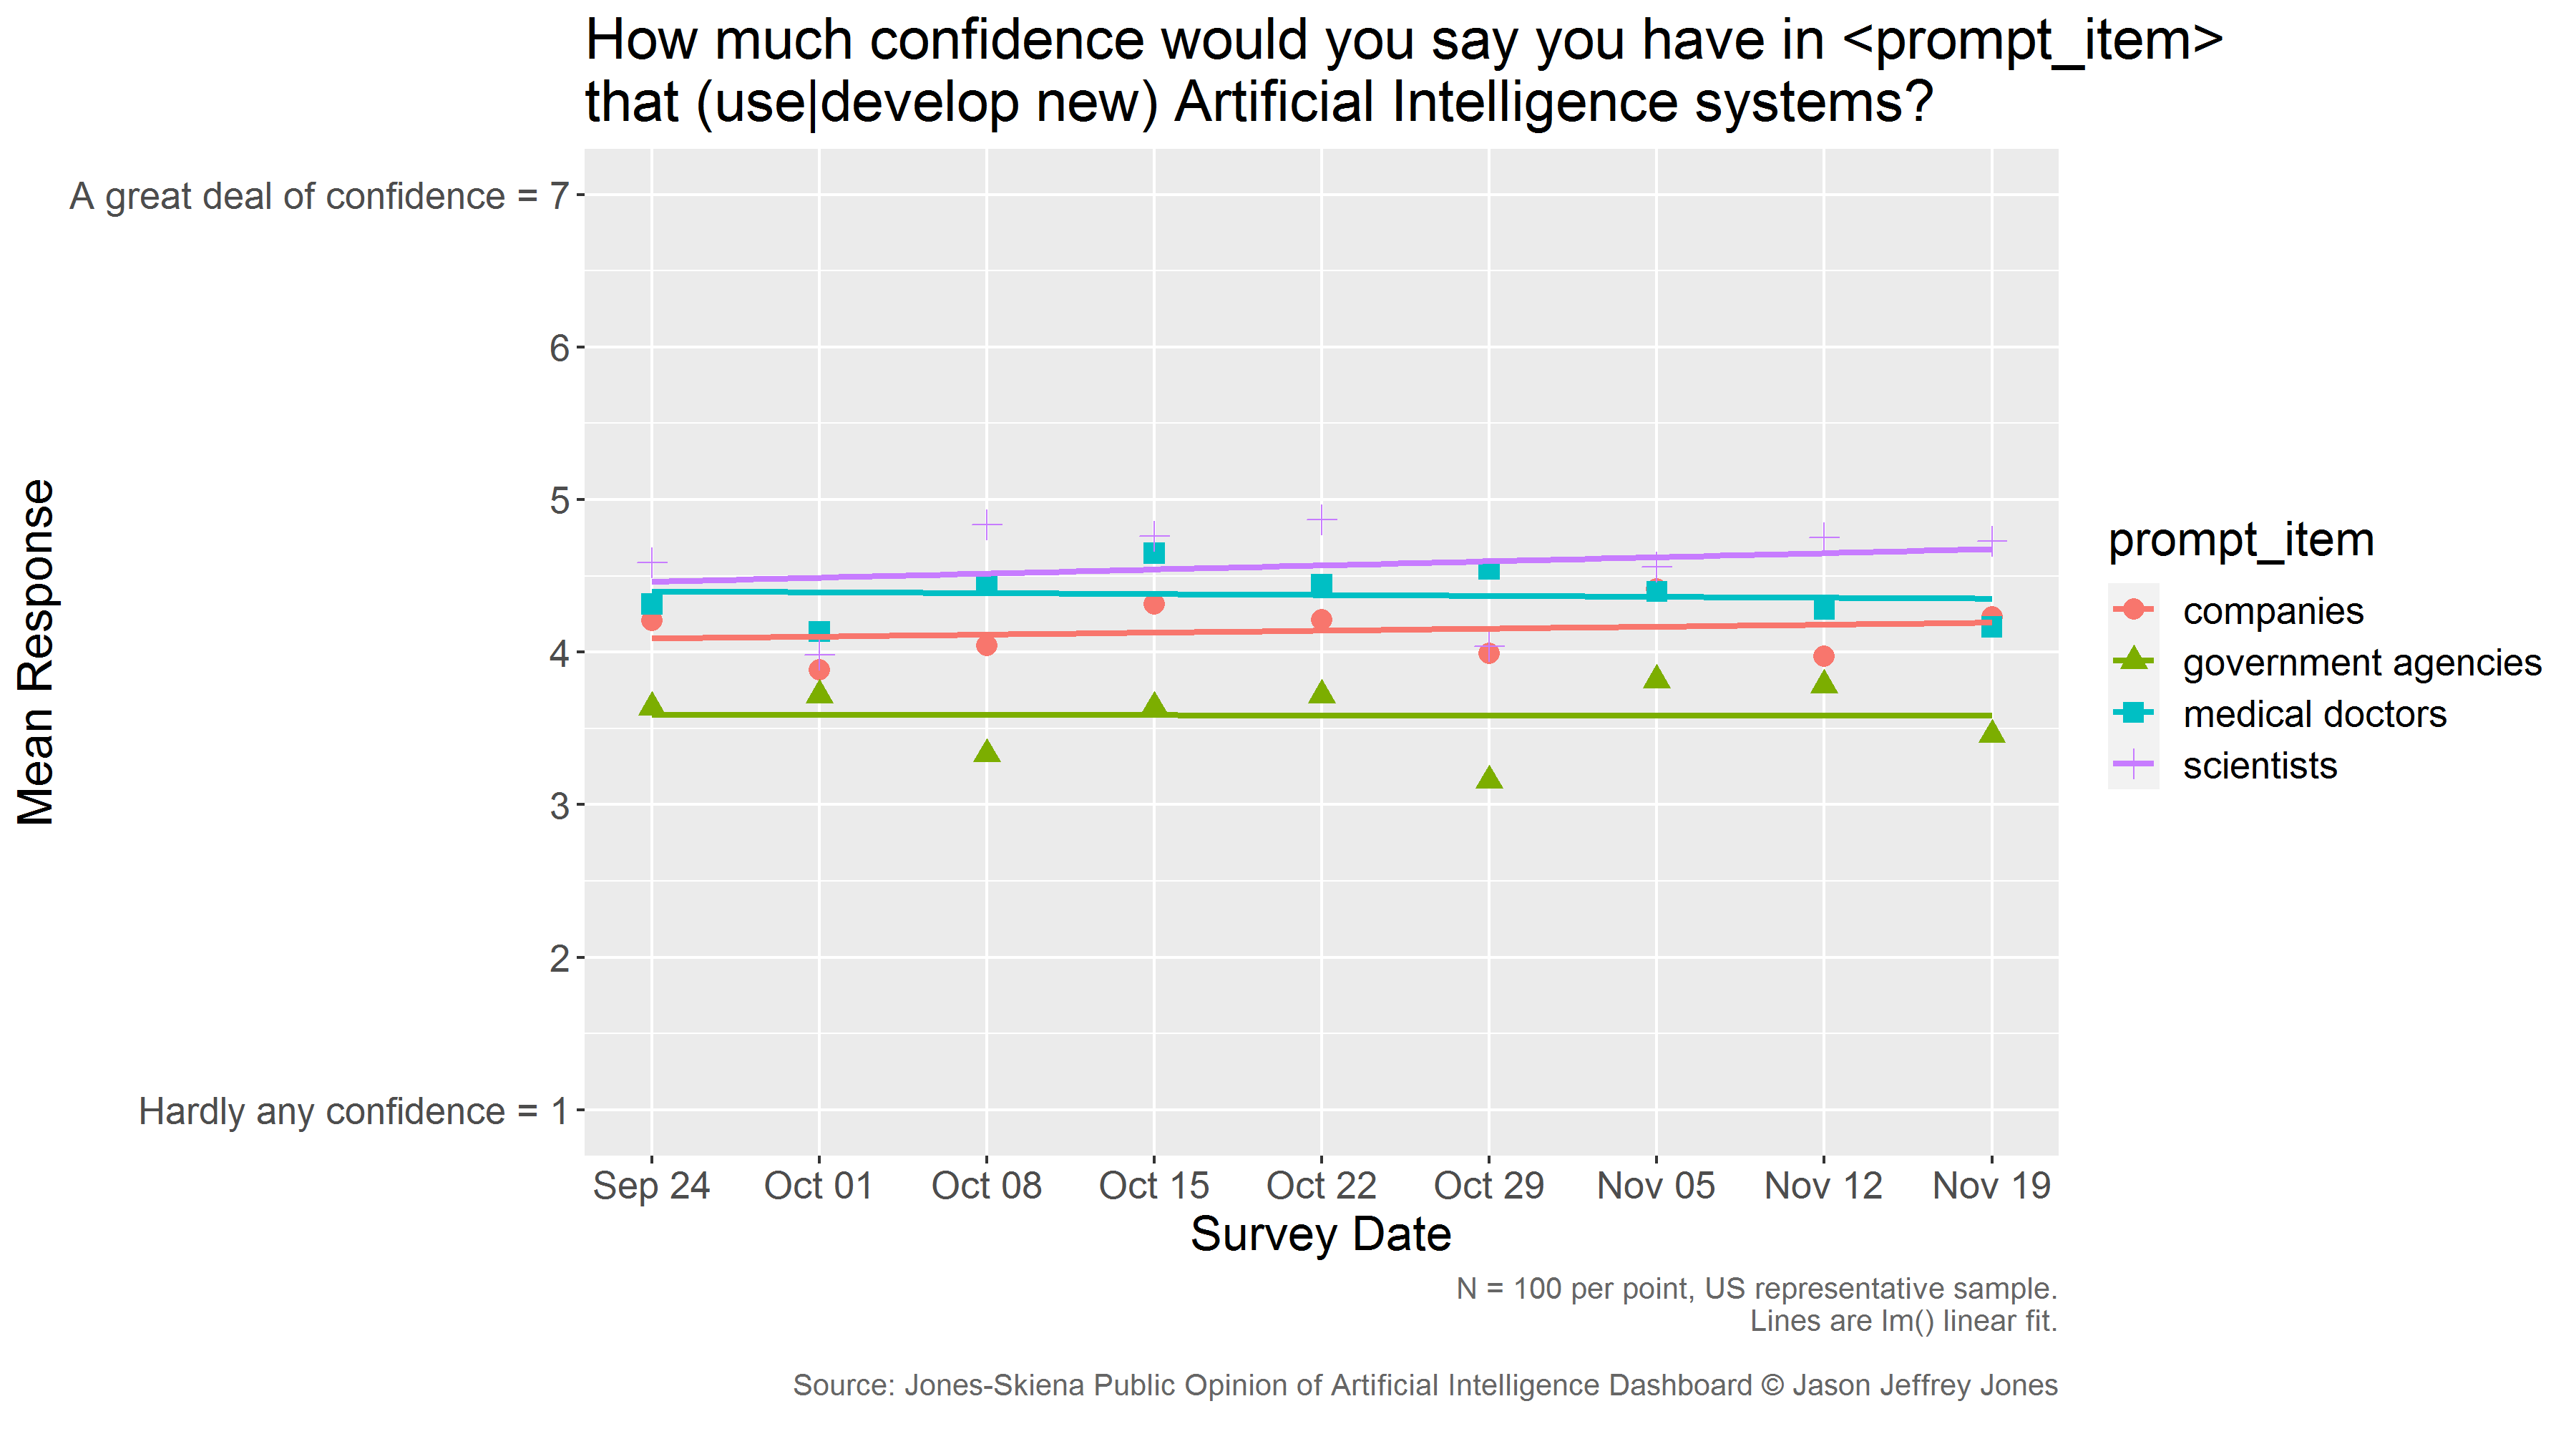
How much confidence would you say you have in <prompt-items> that use Artificial Intelligence systems?
The mean response per week and a linear trend are presented below.
Interpretation
On average, the American public has middling confidence in groups that use Artificial Intelligence. For "scientists" we also change the wording from "use Artificial Intelligence systems" to "develop new Artificial Intelligence systems." We have not tested action (use vs. develop) and <prompt-item> in a factorial design. We doubt it will dramatically move responses.
During the period of observation, confidence has remained stable. The slope estimate for each line is near zero. (None are statistically signficantly different from zero.) This lack of change over time is clearly not due to a ceiling or floor effect. There is plenty of room on the scale for respondents to indicate they have less confidence or more, but the responses point to sustained intermediate levels of confidence, or perhaps indifference.
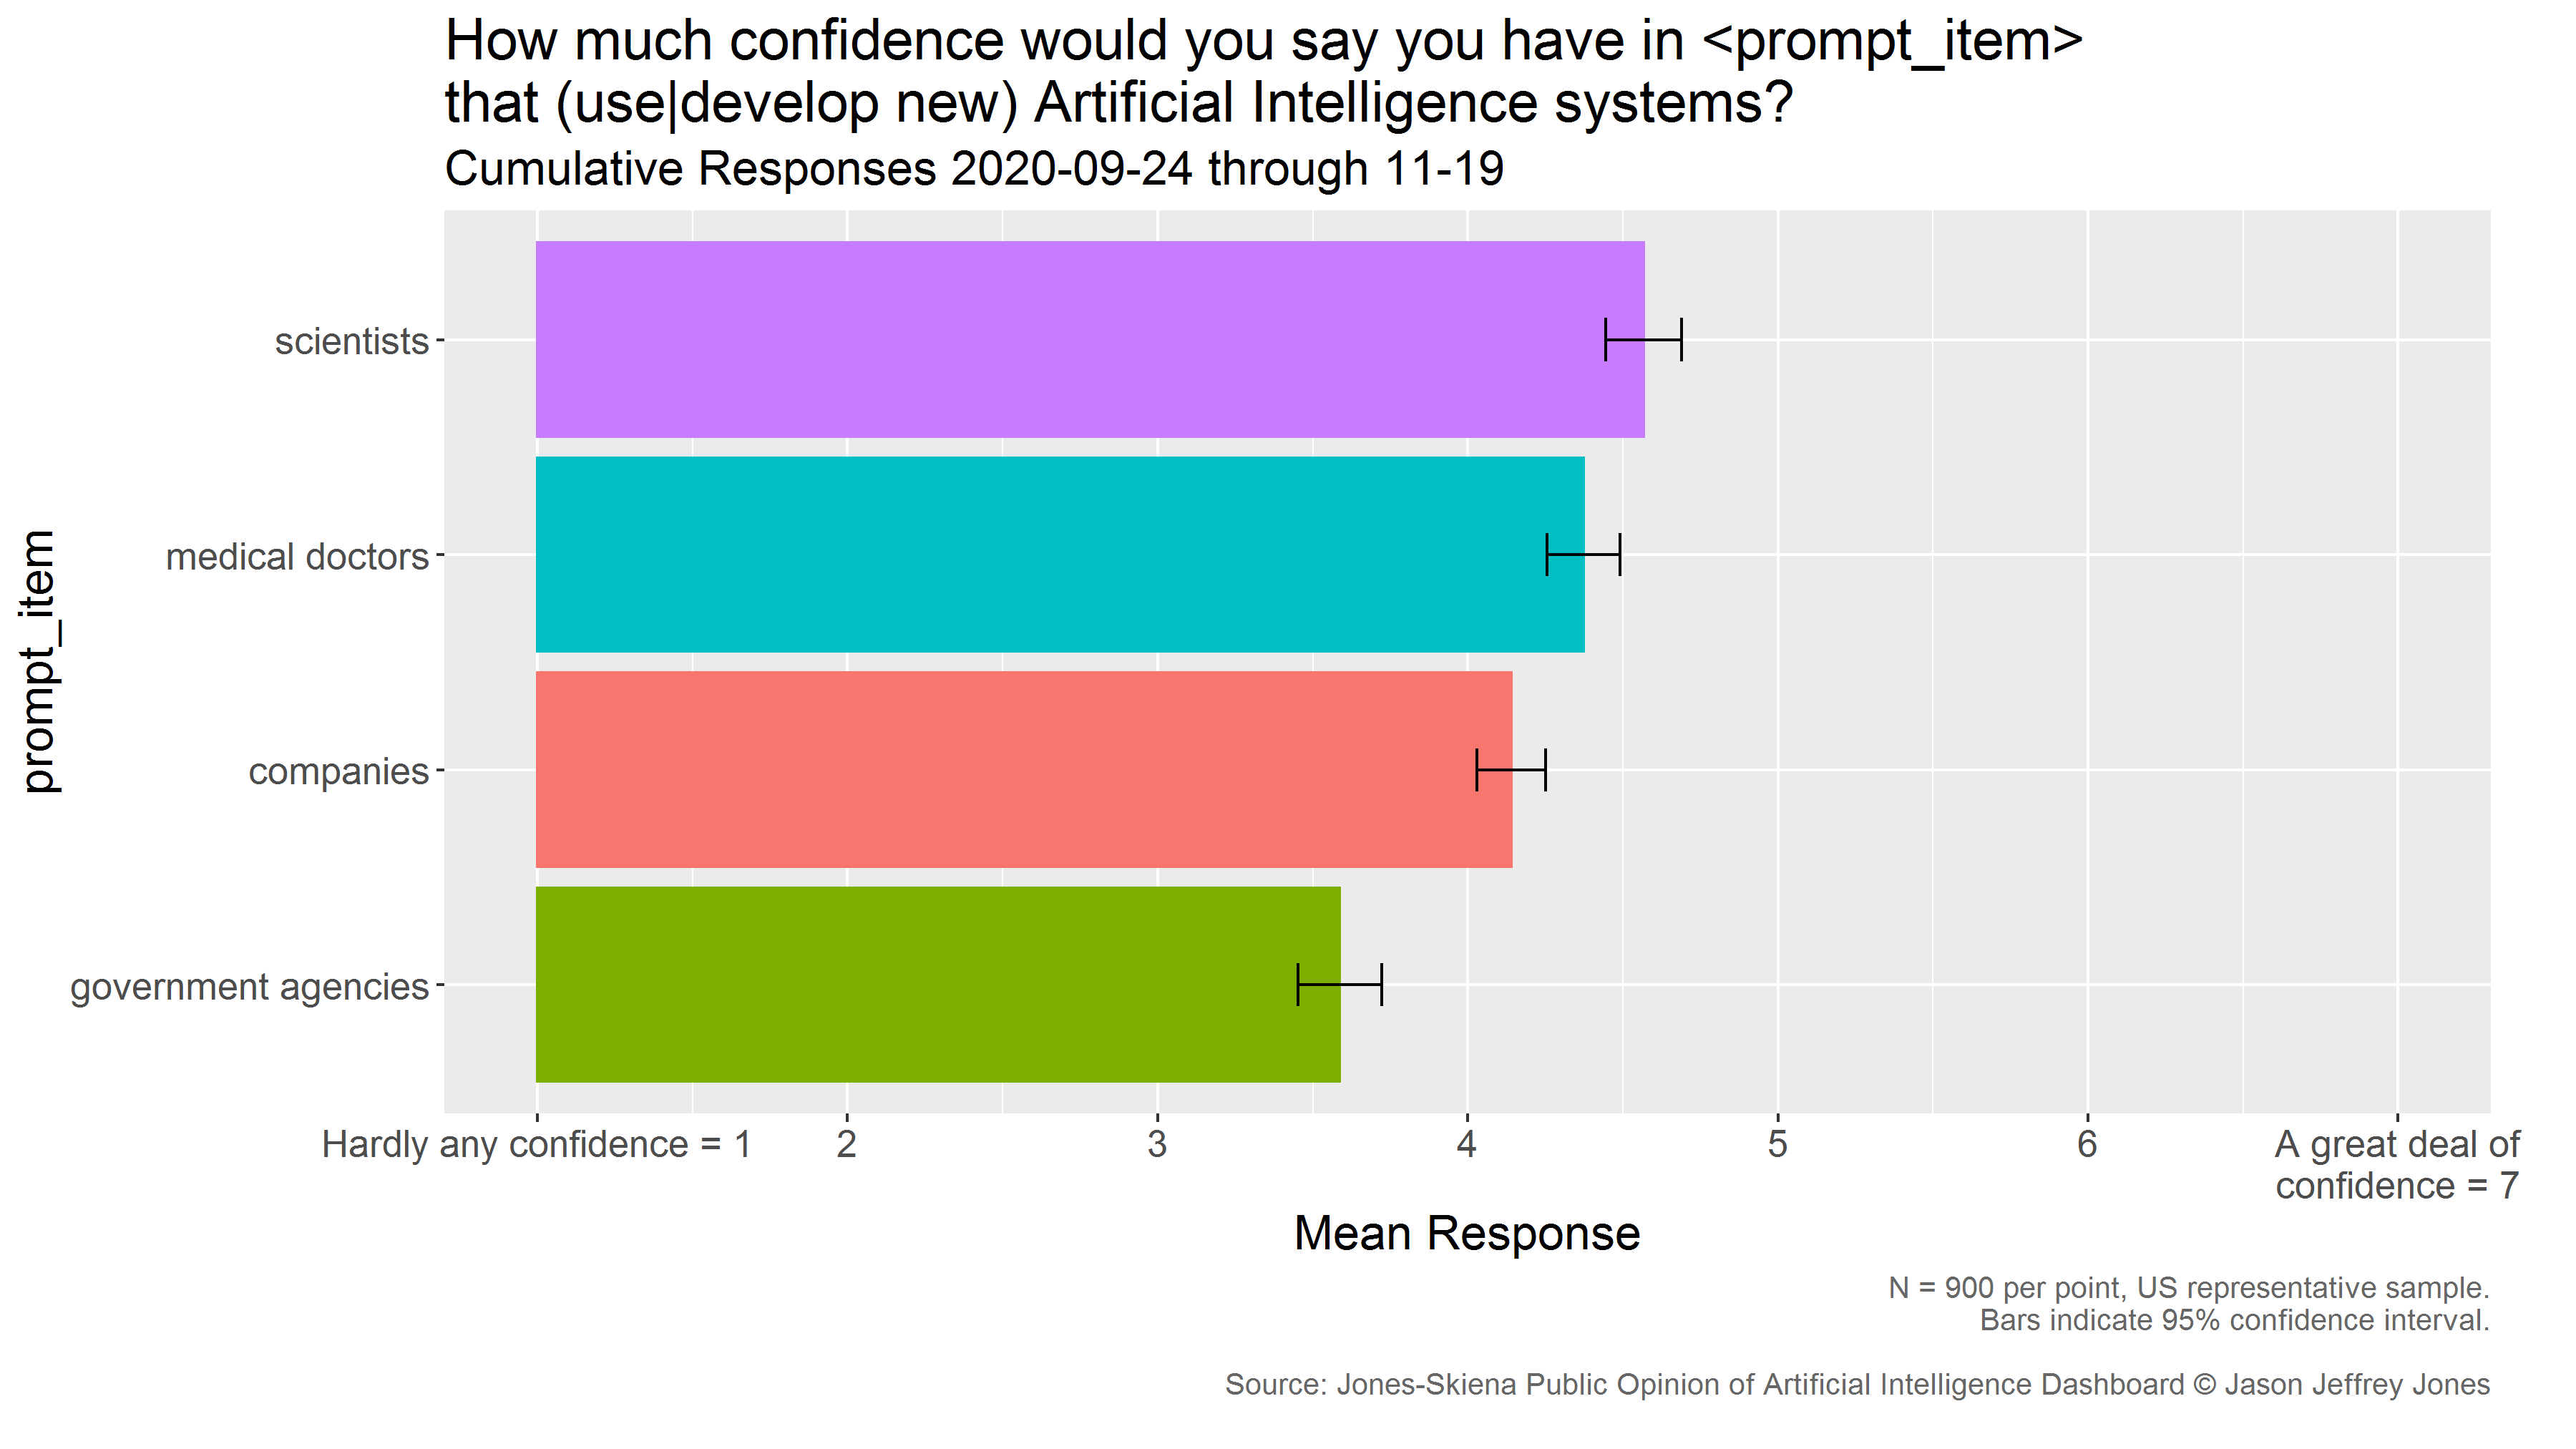
The figure below contrasts the means for each prompt item, collapsing across all dates. One can confidently conclude that Americans place highest confidence in scientists to develop new artificial intelligence systems, followed by medical doctors, companies and government agencies as users of these systems.
Trust in Artificial Intelligence (Relative to other targets)
We deliver items of the following form every month to a random, representative sample of 100 Americans:
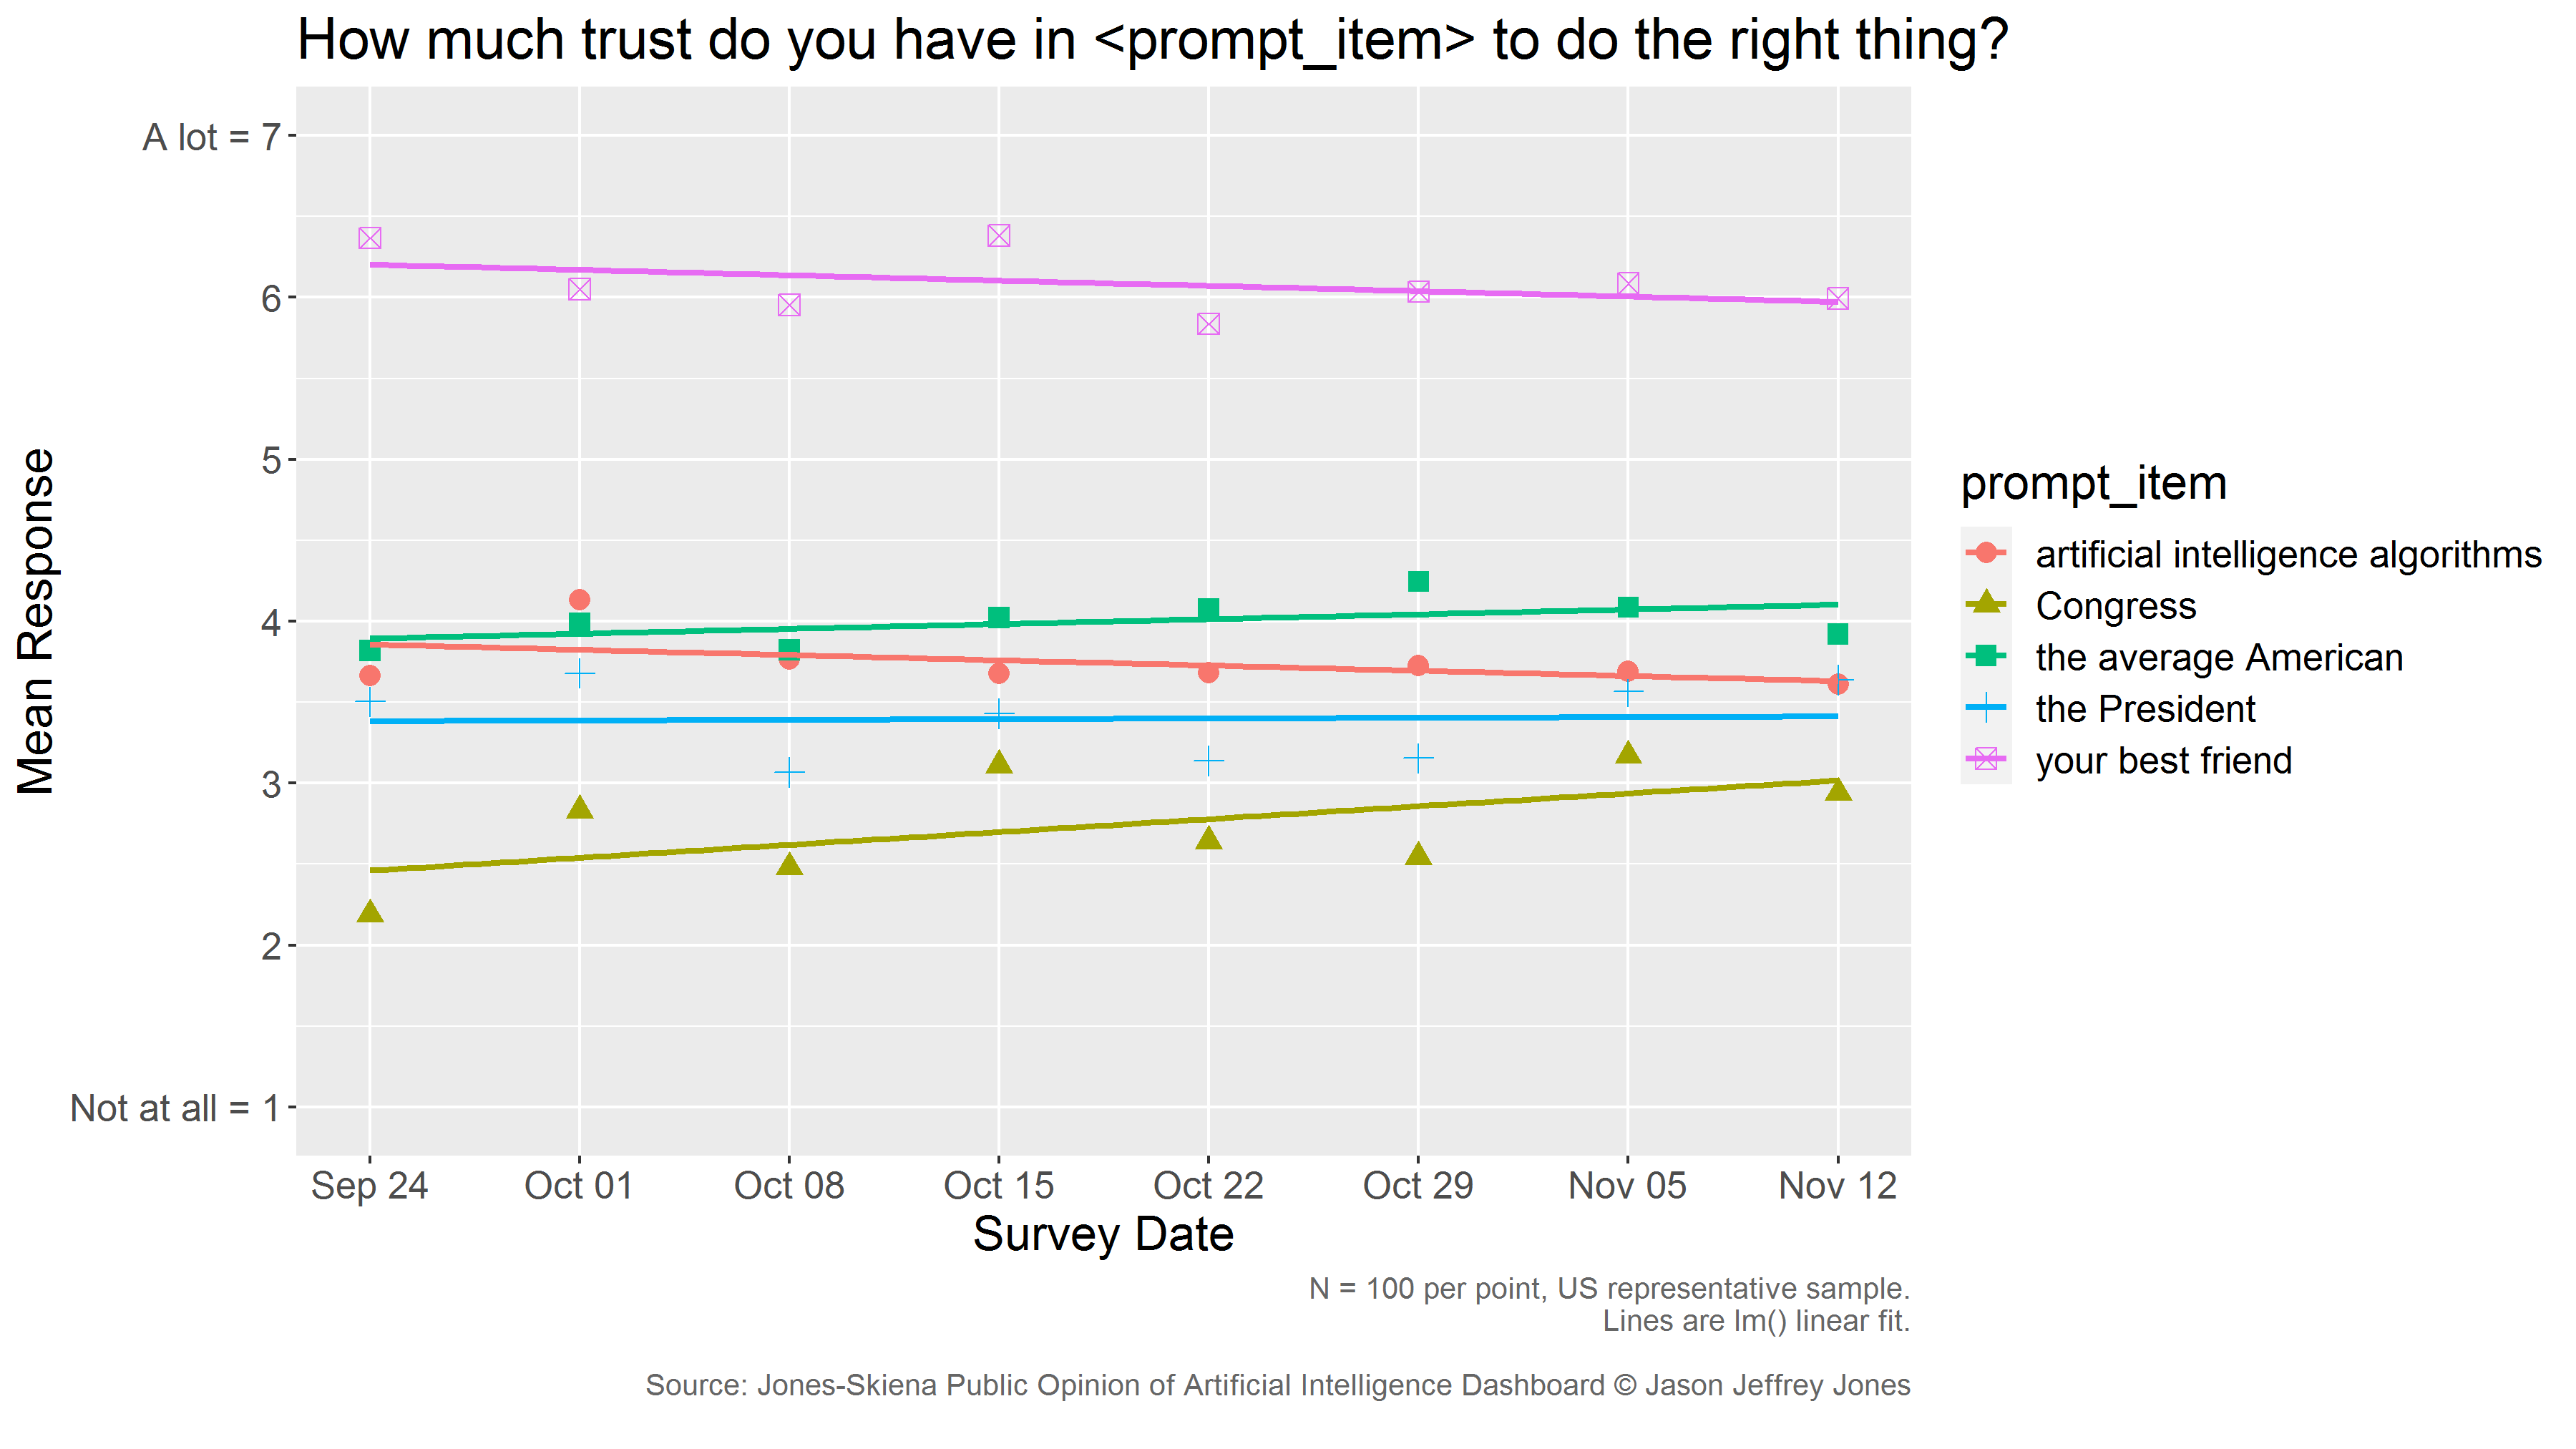
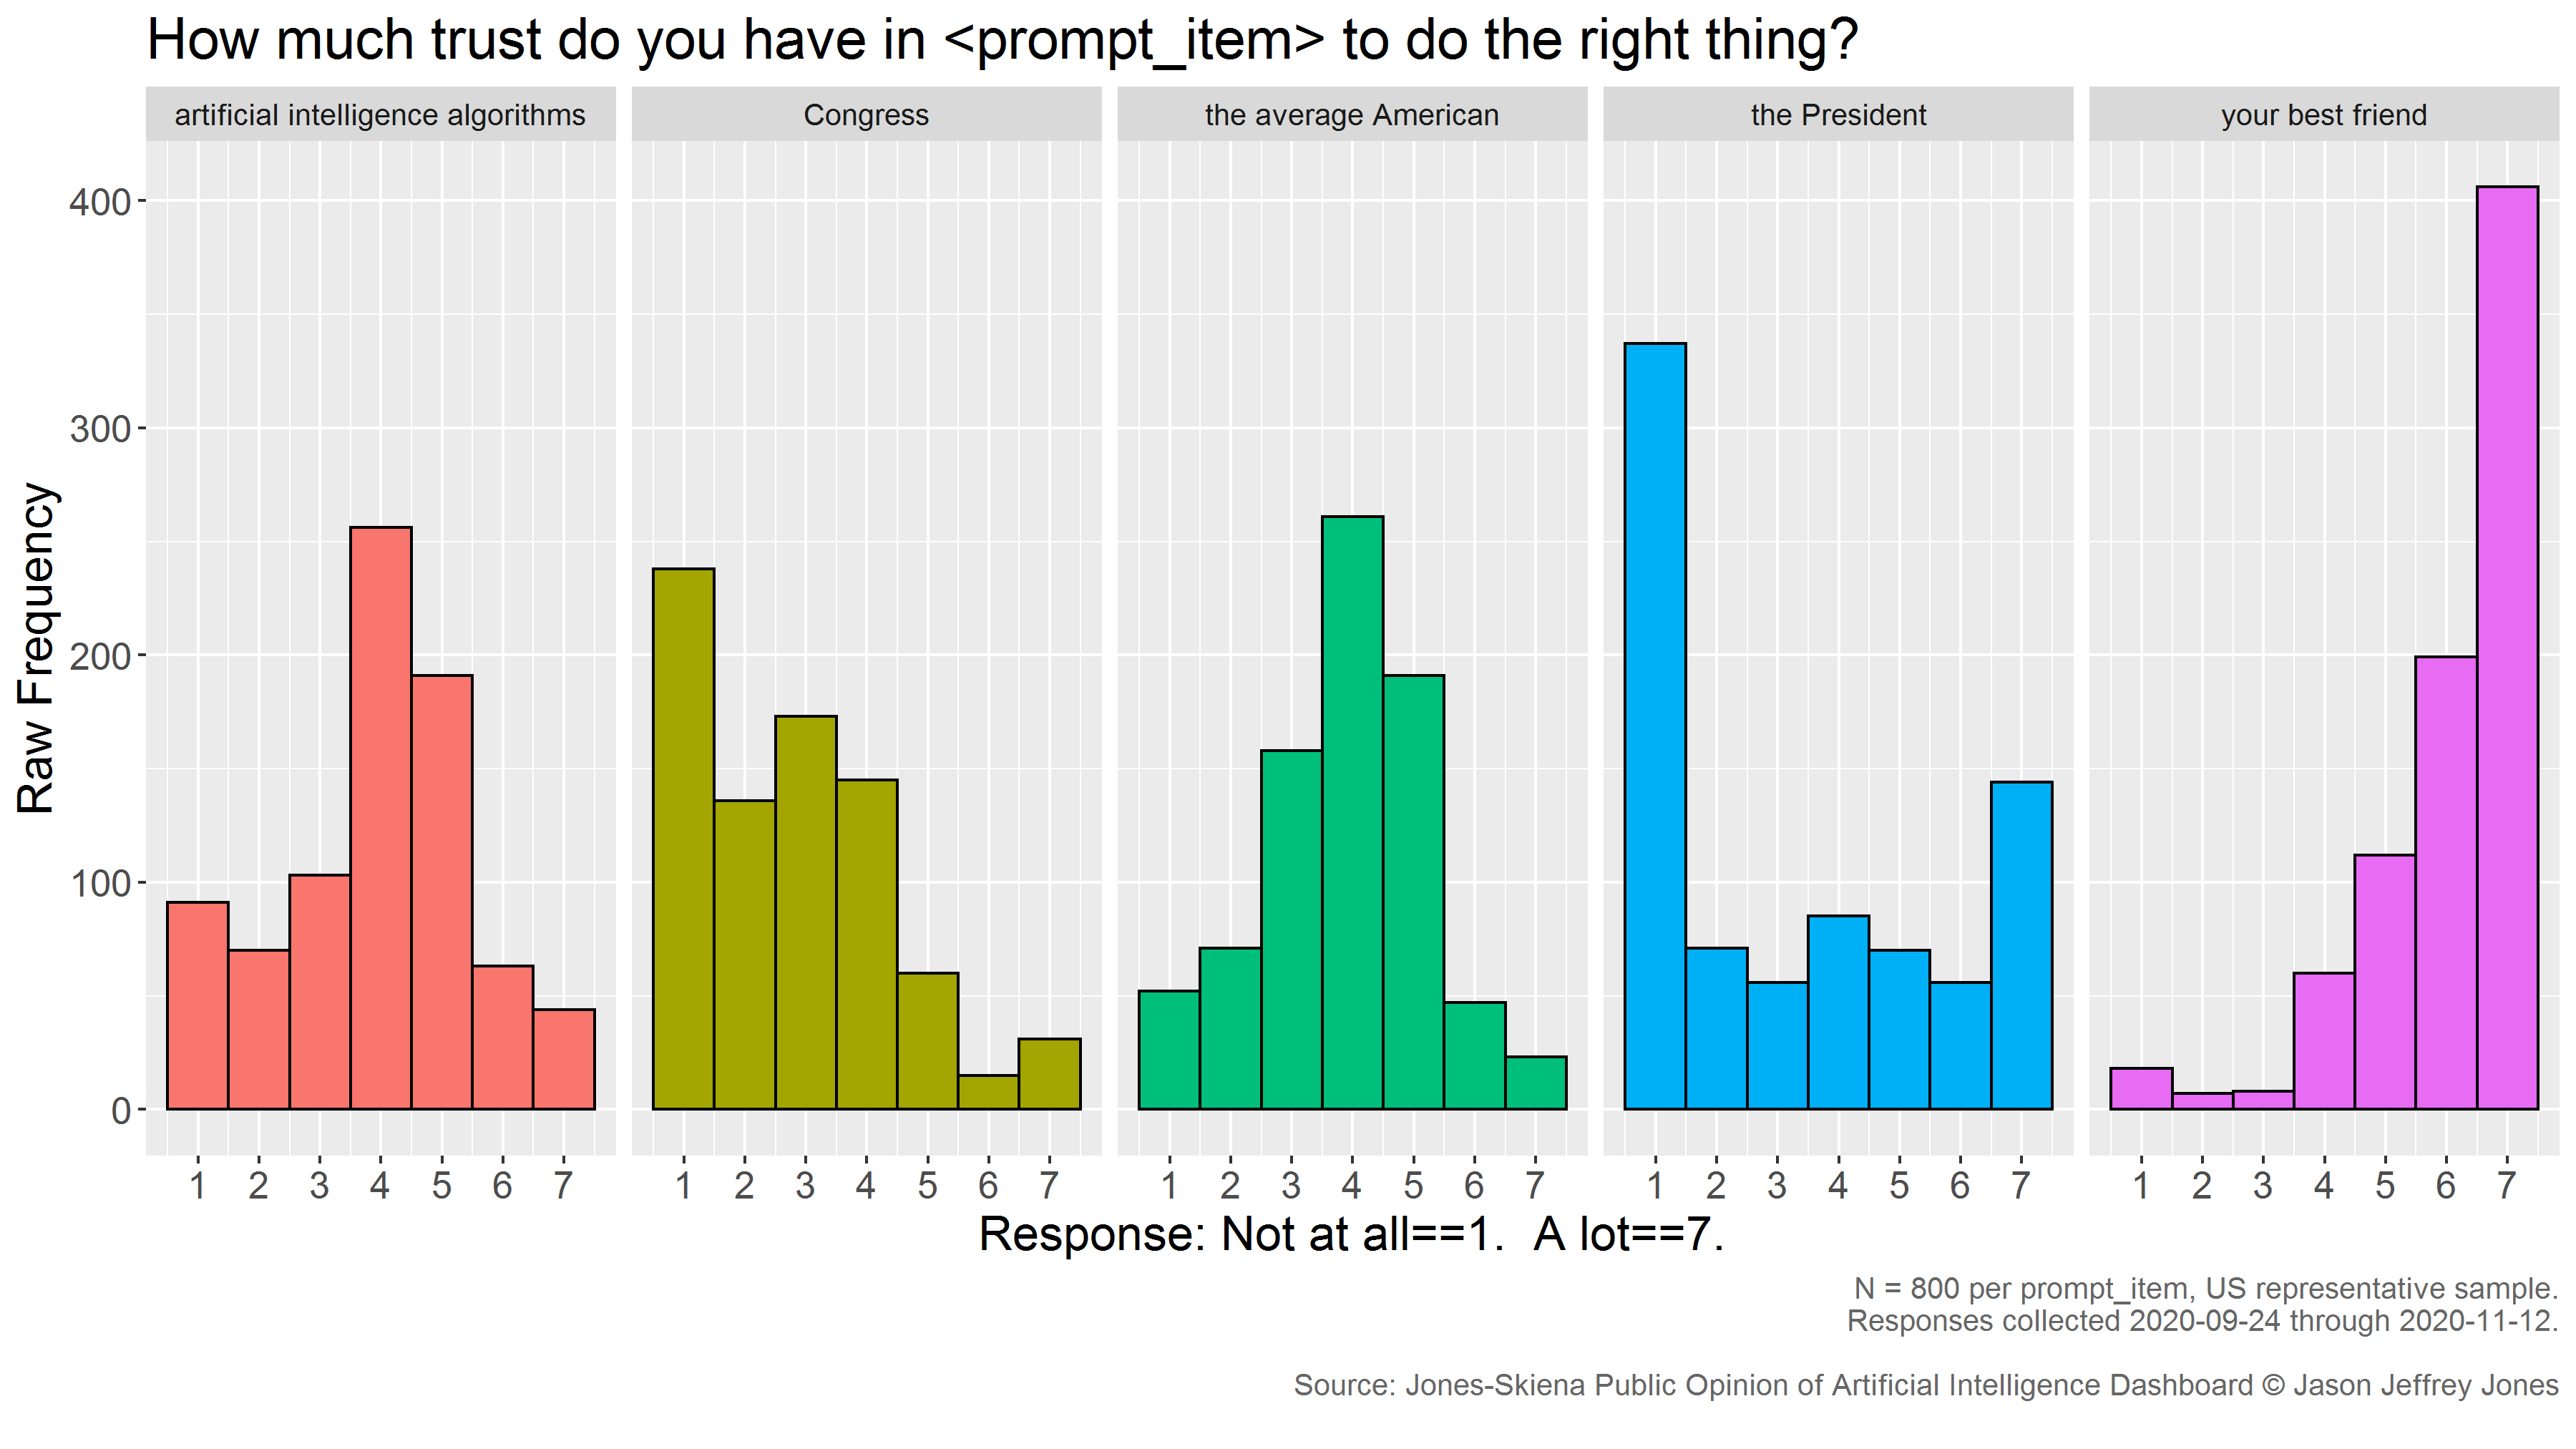
How much trust do you have in <prompt-item> to do the right thing?
The mean response per week and a linear trend are presented below.
Interpretation
On average, the American public trusts "artificial intelligence algorithms" to do the right thing just a little less than they trust the average American. Americans trust artificial intelligence algorithms more than Congress or the President, but not as much as their best friend. Pooling the data and weighting to match demographics, we may estimate the following 95% confidence intervals.
| prompt_item | Lower (95% CI) | Upper (95% CI) |
|---|---|---|
| your best friend | 5.97 | 6.20 |
| the average American | 3.89 | 4.11 |
| artificial intelligence algorithms | 3.60 | 3.88 |
| the President | 3.20 | 3.60 |
| Congress | 2.59 | 2.89 |
If you were thinking that these trust survey items would have interesting distributions, you'd be right.
During the period of observation, the magnitude and ordering of trust in these targets has remained stable. Trendlines are shown to aid the eye, but every slope except that for Congress is not statistically significantly different from zero. (To interpet as you may: slope estimate for Congress is +0.08 per week, p = 0.0173)
Familiarity with Artificial Intelligence
We deliver items of the following form every month to a random, representative sample of 100 Americans:
How familiar are you with the following computer-related item? <prompt-item>
The mean response per week and a linear trend are presented below.
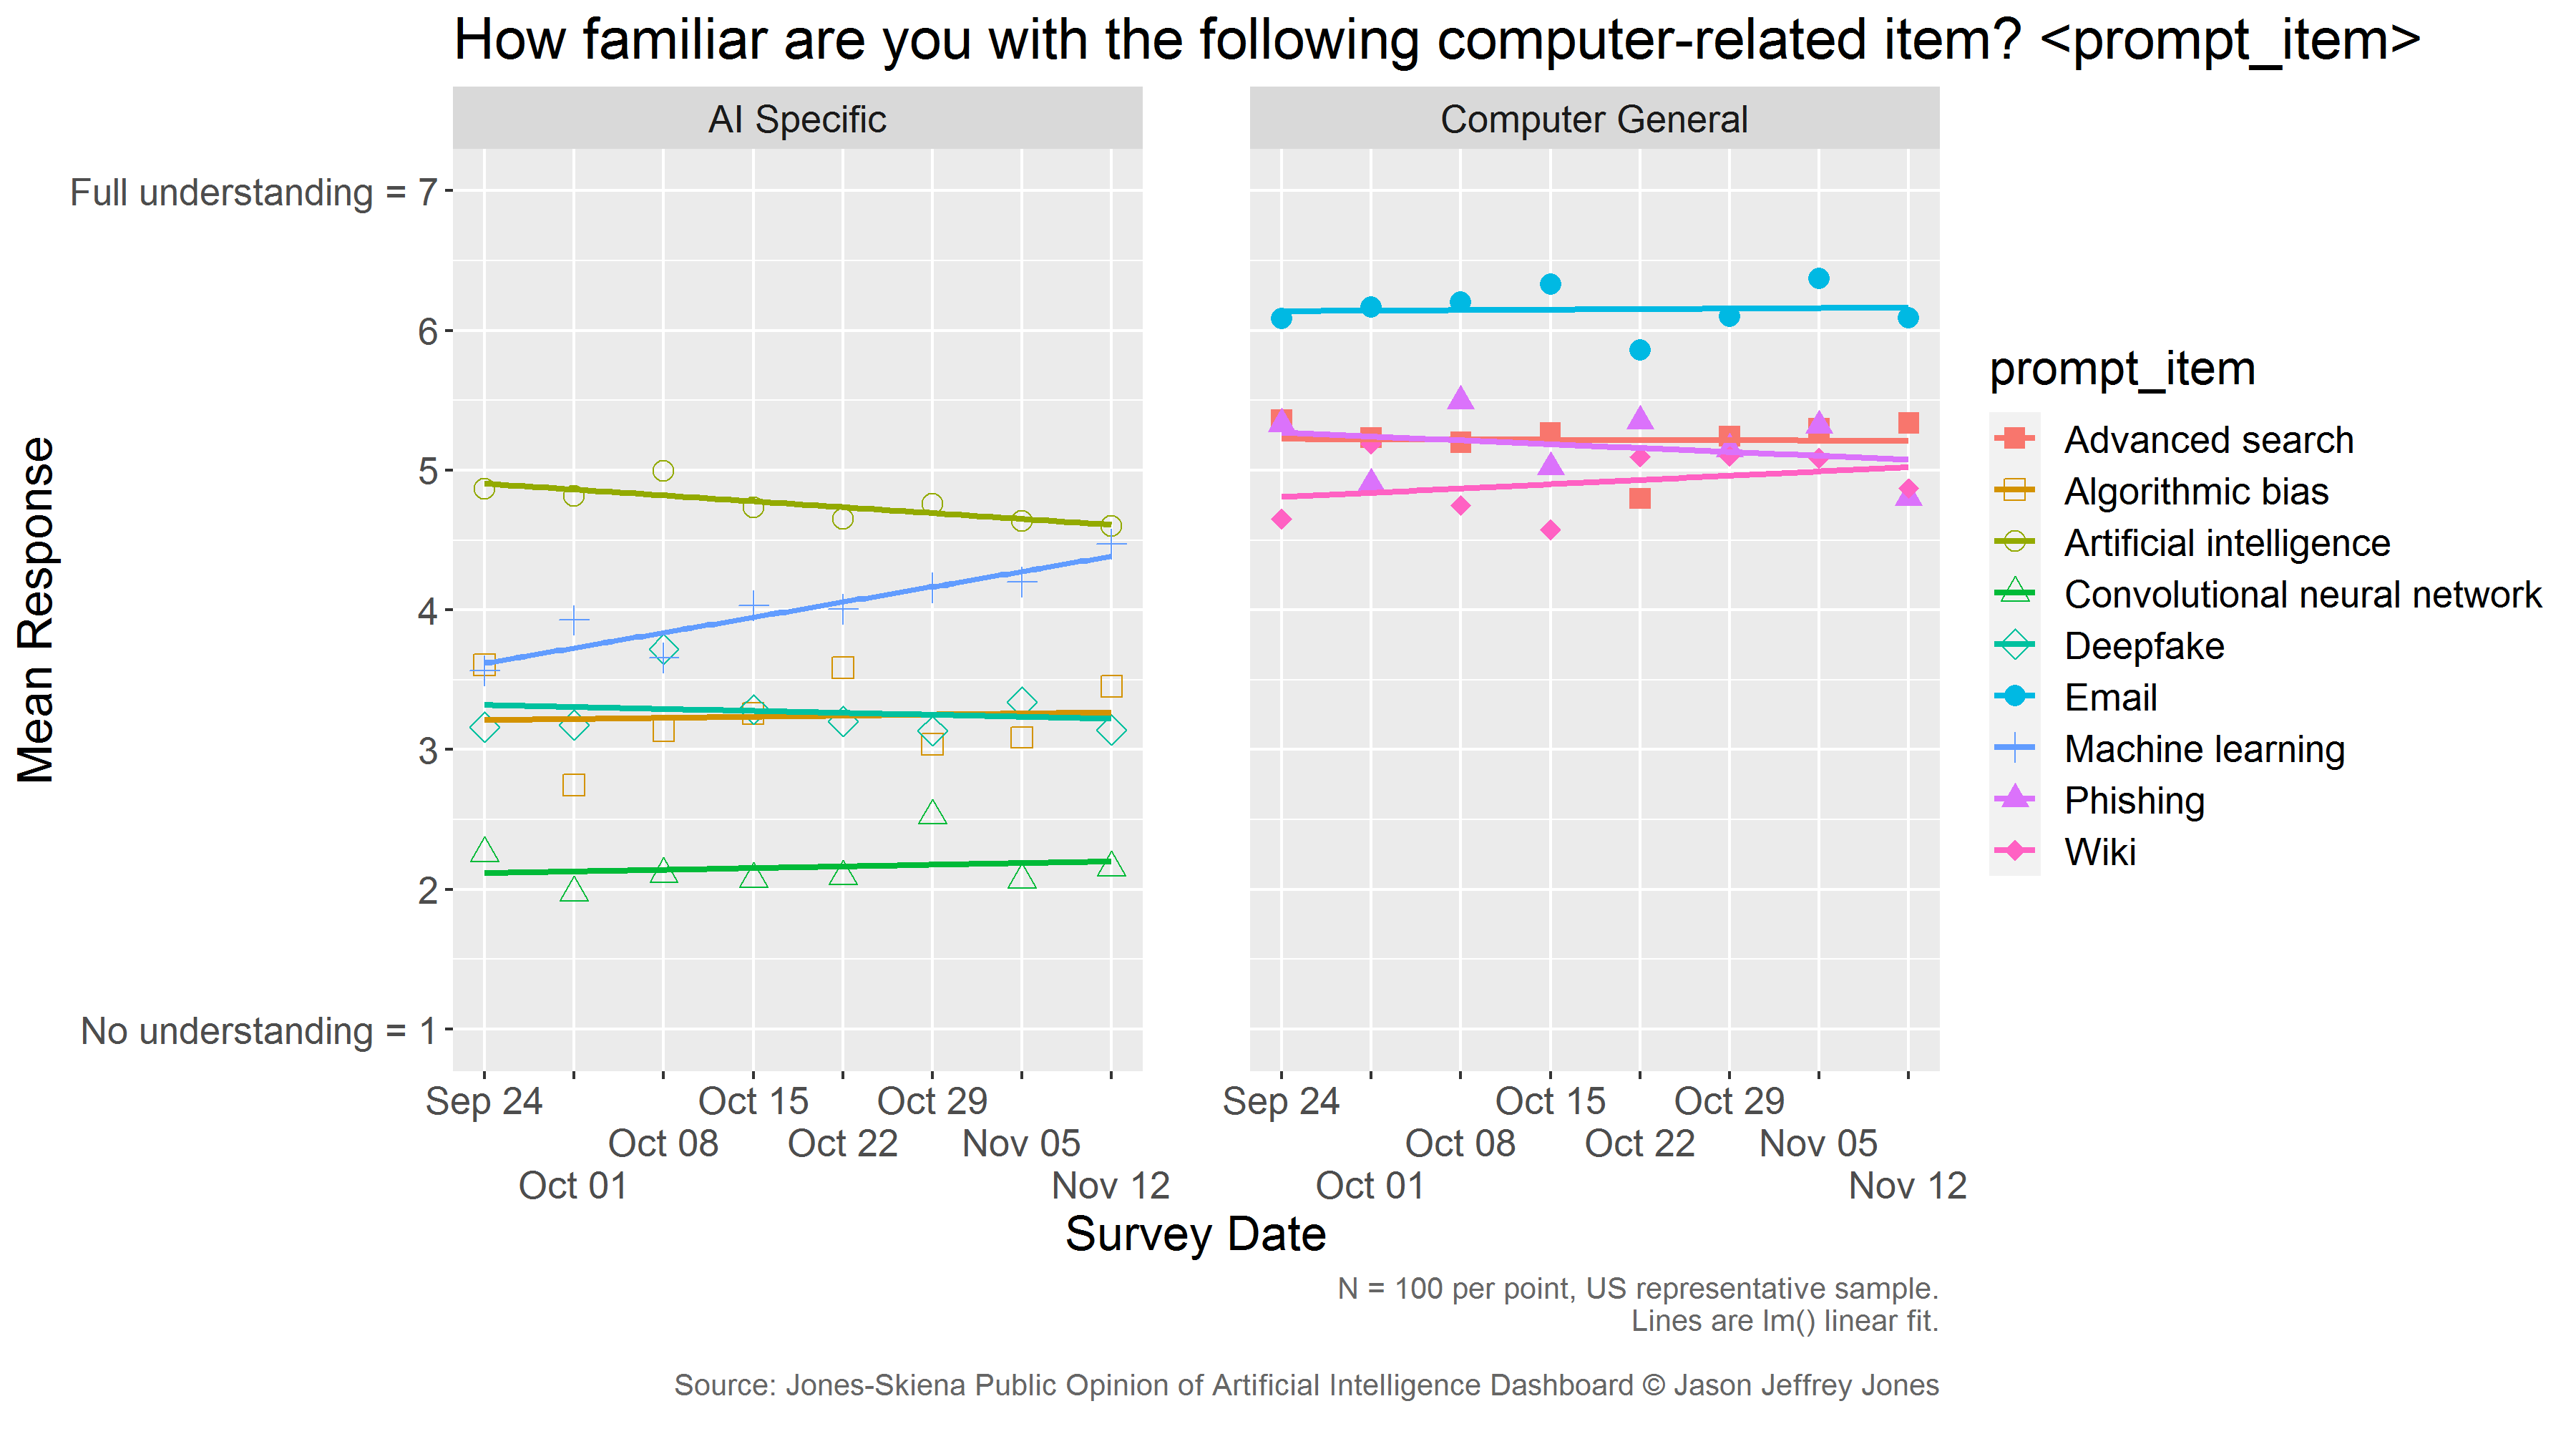
Interpretation
On average, the American public self-reports less understanding of Artificial Intellgience terms as compared to other computer terms. Pooling the data and weighting to match demographics, we may estimate the following 95% confidence intervals.
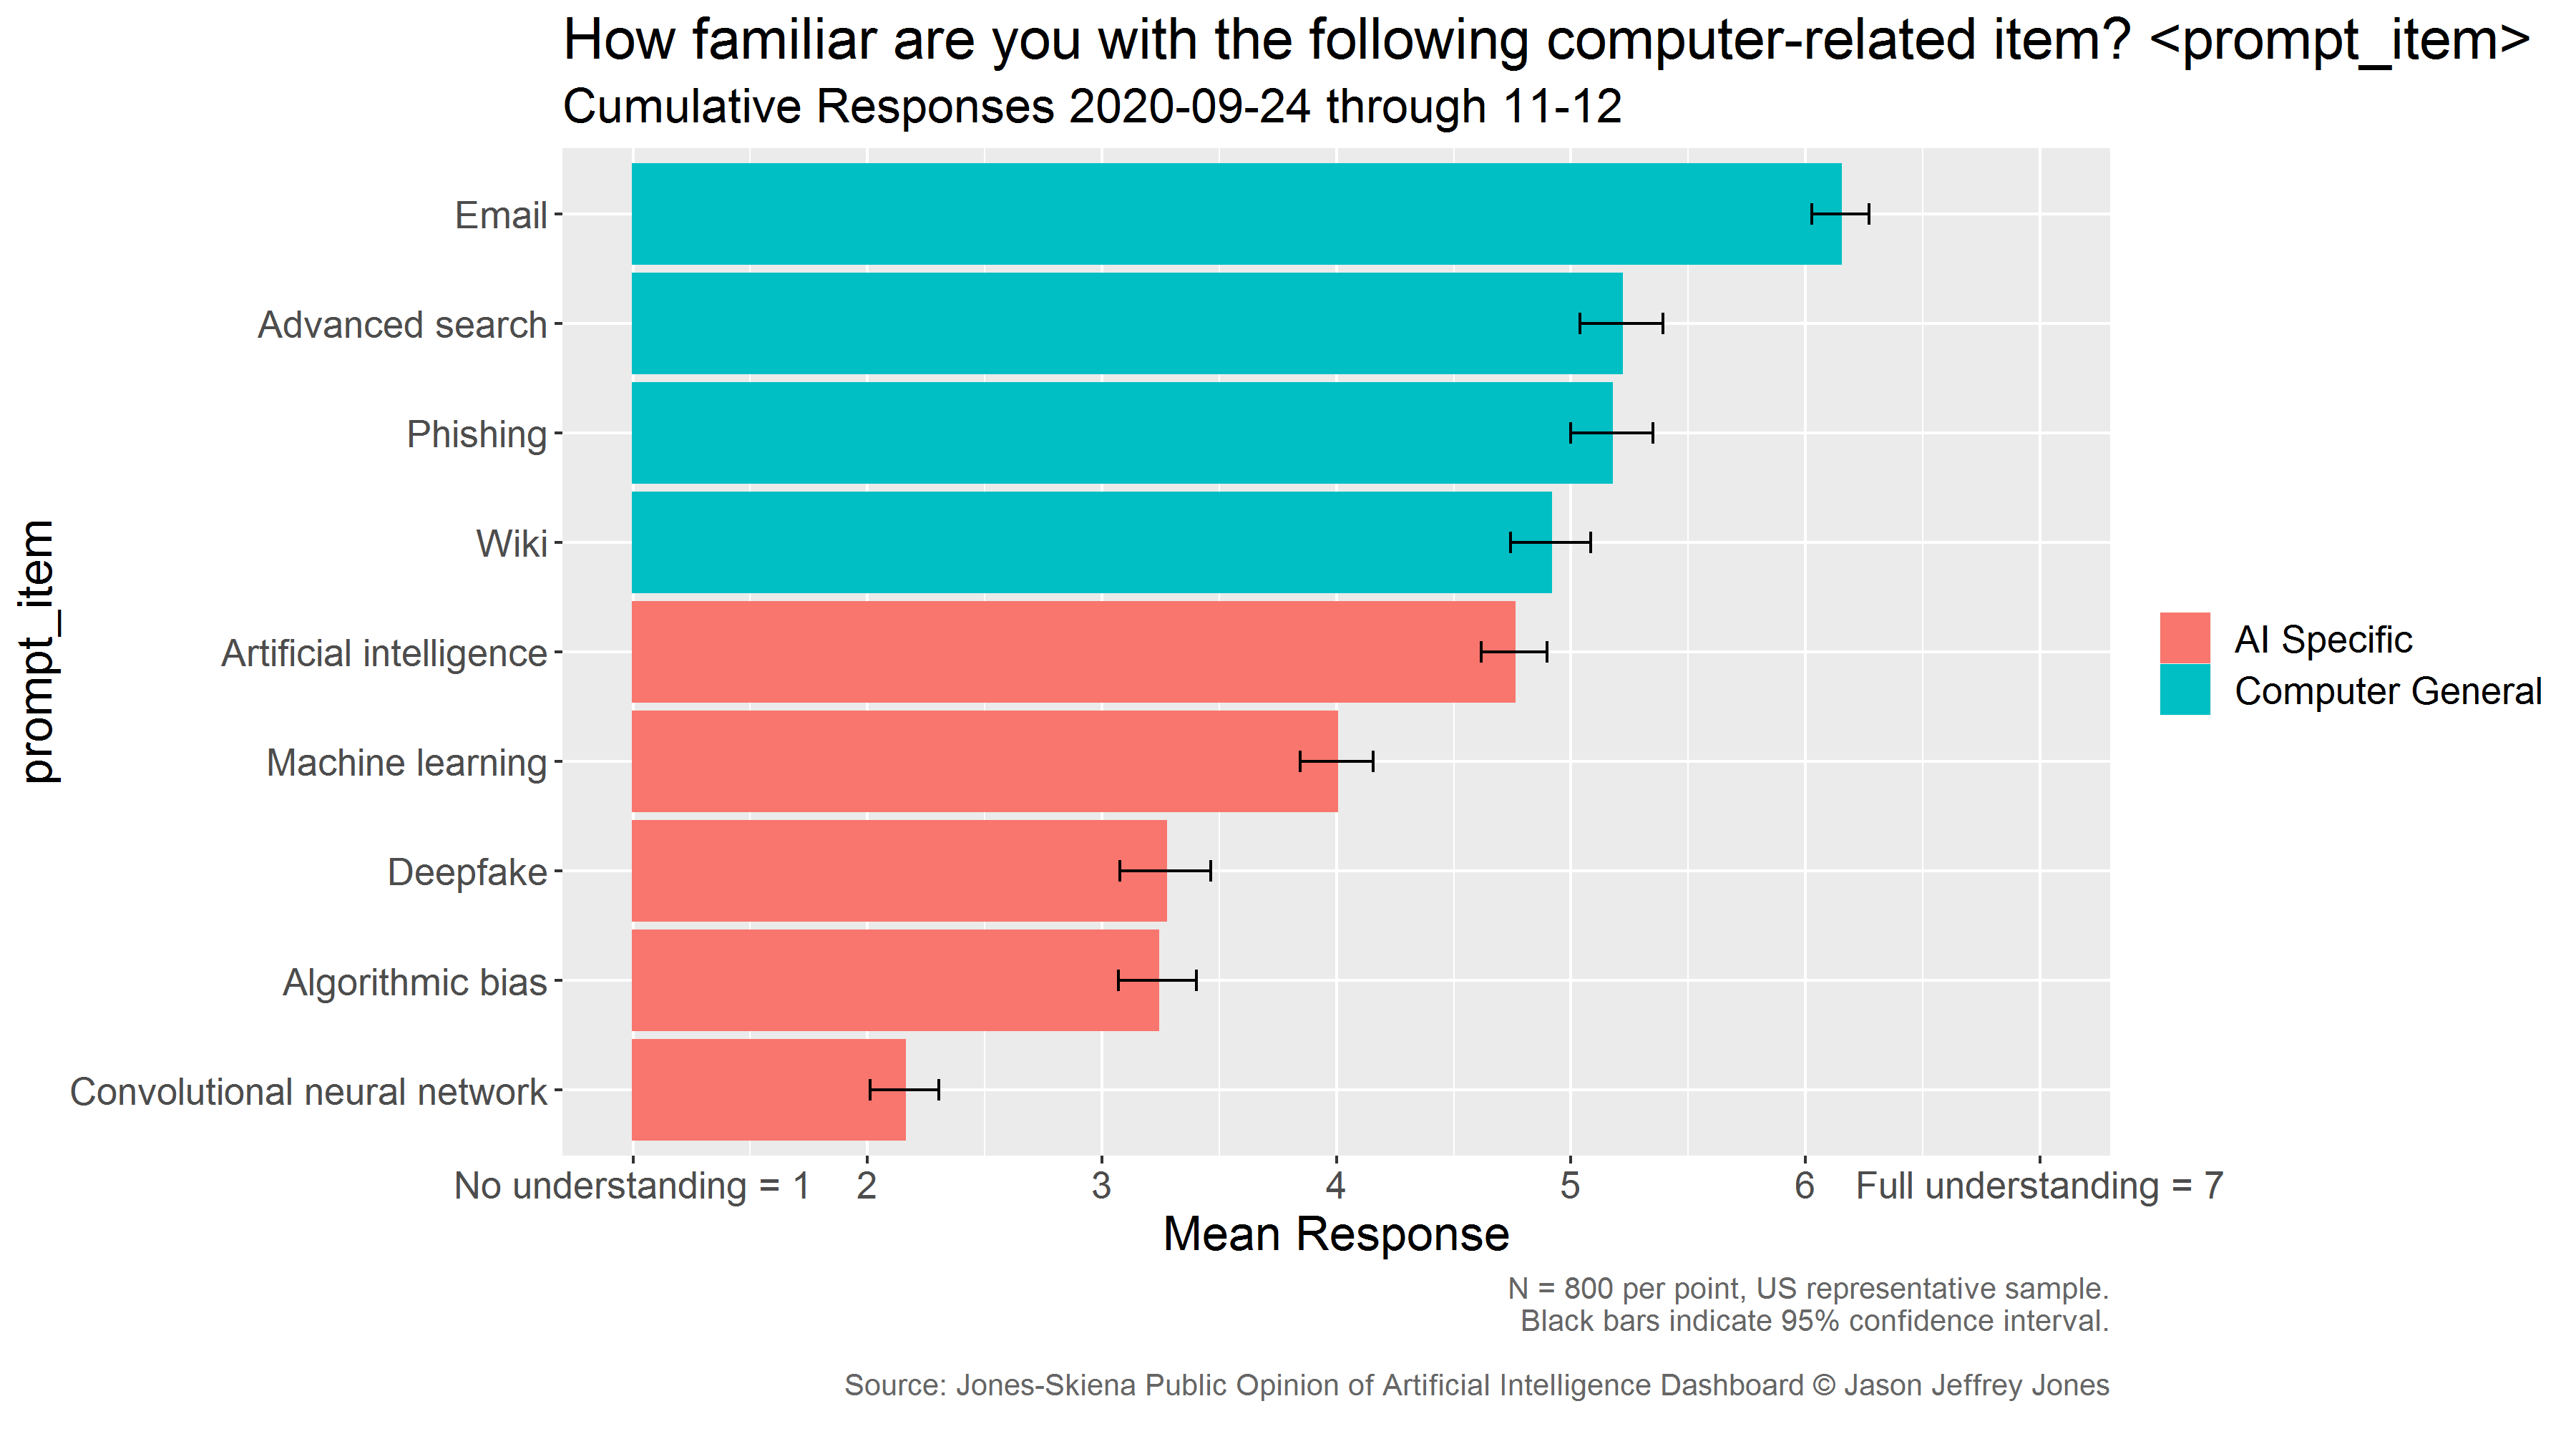
During the period of observation, self-reported familiarity has remained stable for most targets. The standout is "Machine learning." The slope estimate is +0.11 per week, p = 0.00211. The increase in this series is so exceptional and conistent that we believe one should treat this a real phenomenon. Americans report their understanding of machine learning has increased over the past two months. We find it hard to believe this pace will continue, however. We predict the slope will taper as understanding of machine learning approaches the value of artificial intelligence.
These surveys are conducted by Dr. Jason Jeffrey Jones and Dr. Steven Sol Skiena. All raw data is available at this Open Science Foundation repository. Please include proper attribution any time you make use of our work. Read more about the Jones-Skiena Public Opinion of AI Dashboard.