Jones-Skiena Public Opinion of Artificial Intelligence Dashboard
2021-02-22 Update
 -- Dr. Jason Jeffrey Jones -- @jasonjones_jjj
 -- Dr. Steven Sol Skiena -- @stevenskiena
Support for the Development of Artificial Intelligence
We deliver the following item every week to a random, representative sample of 100 Americans:
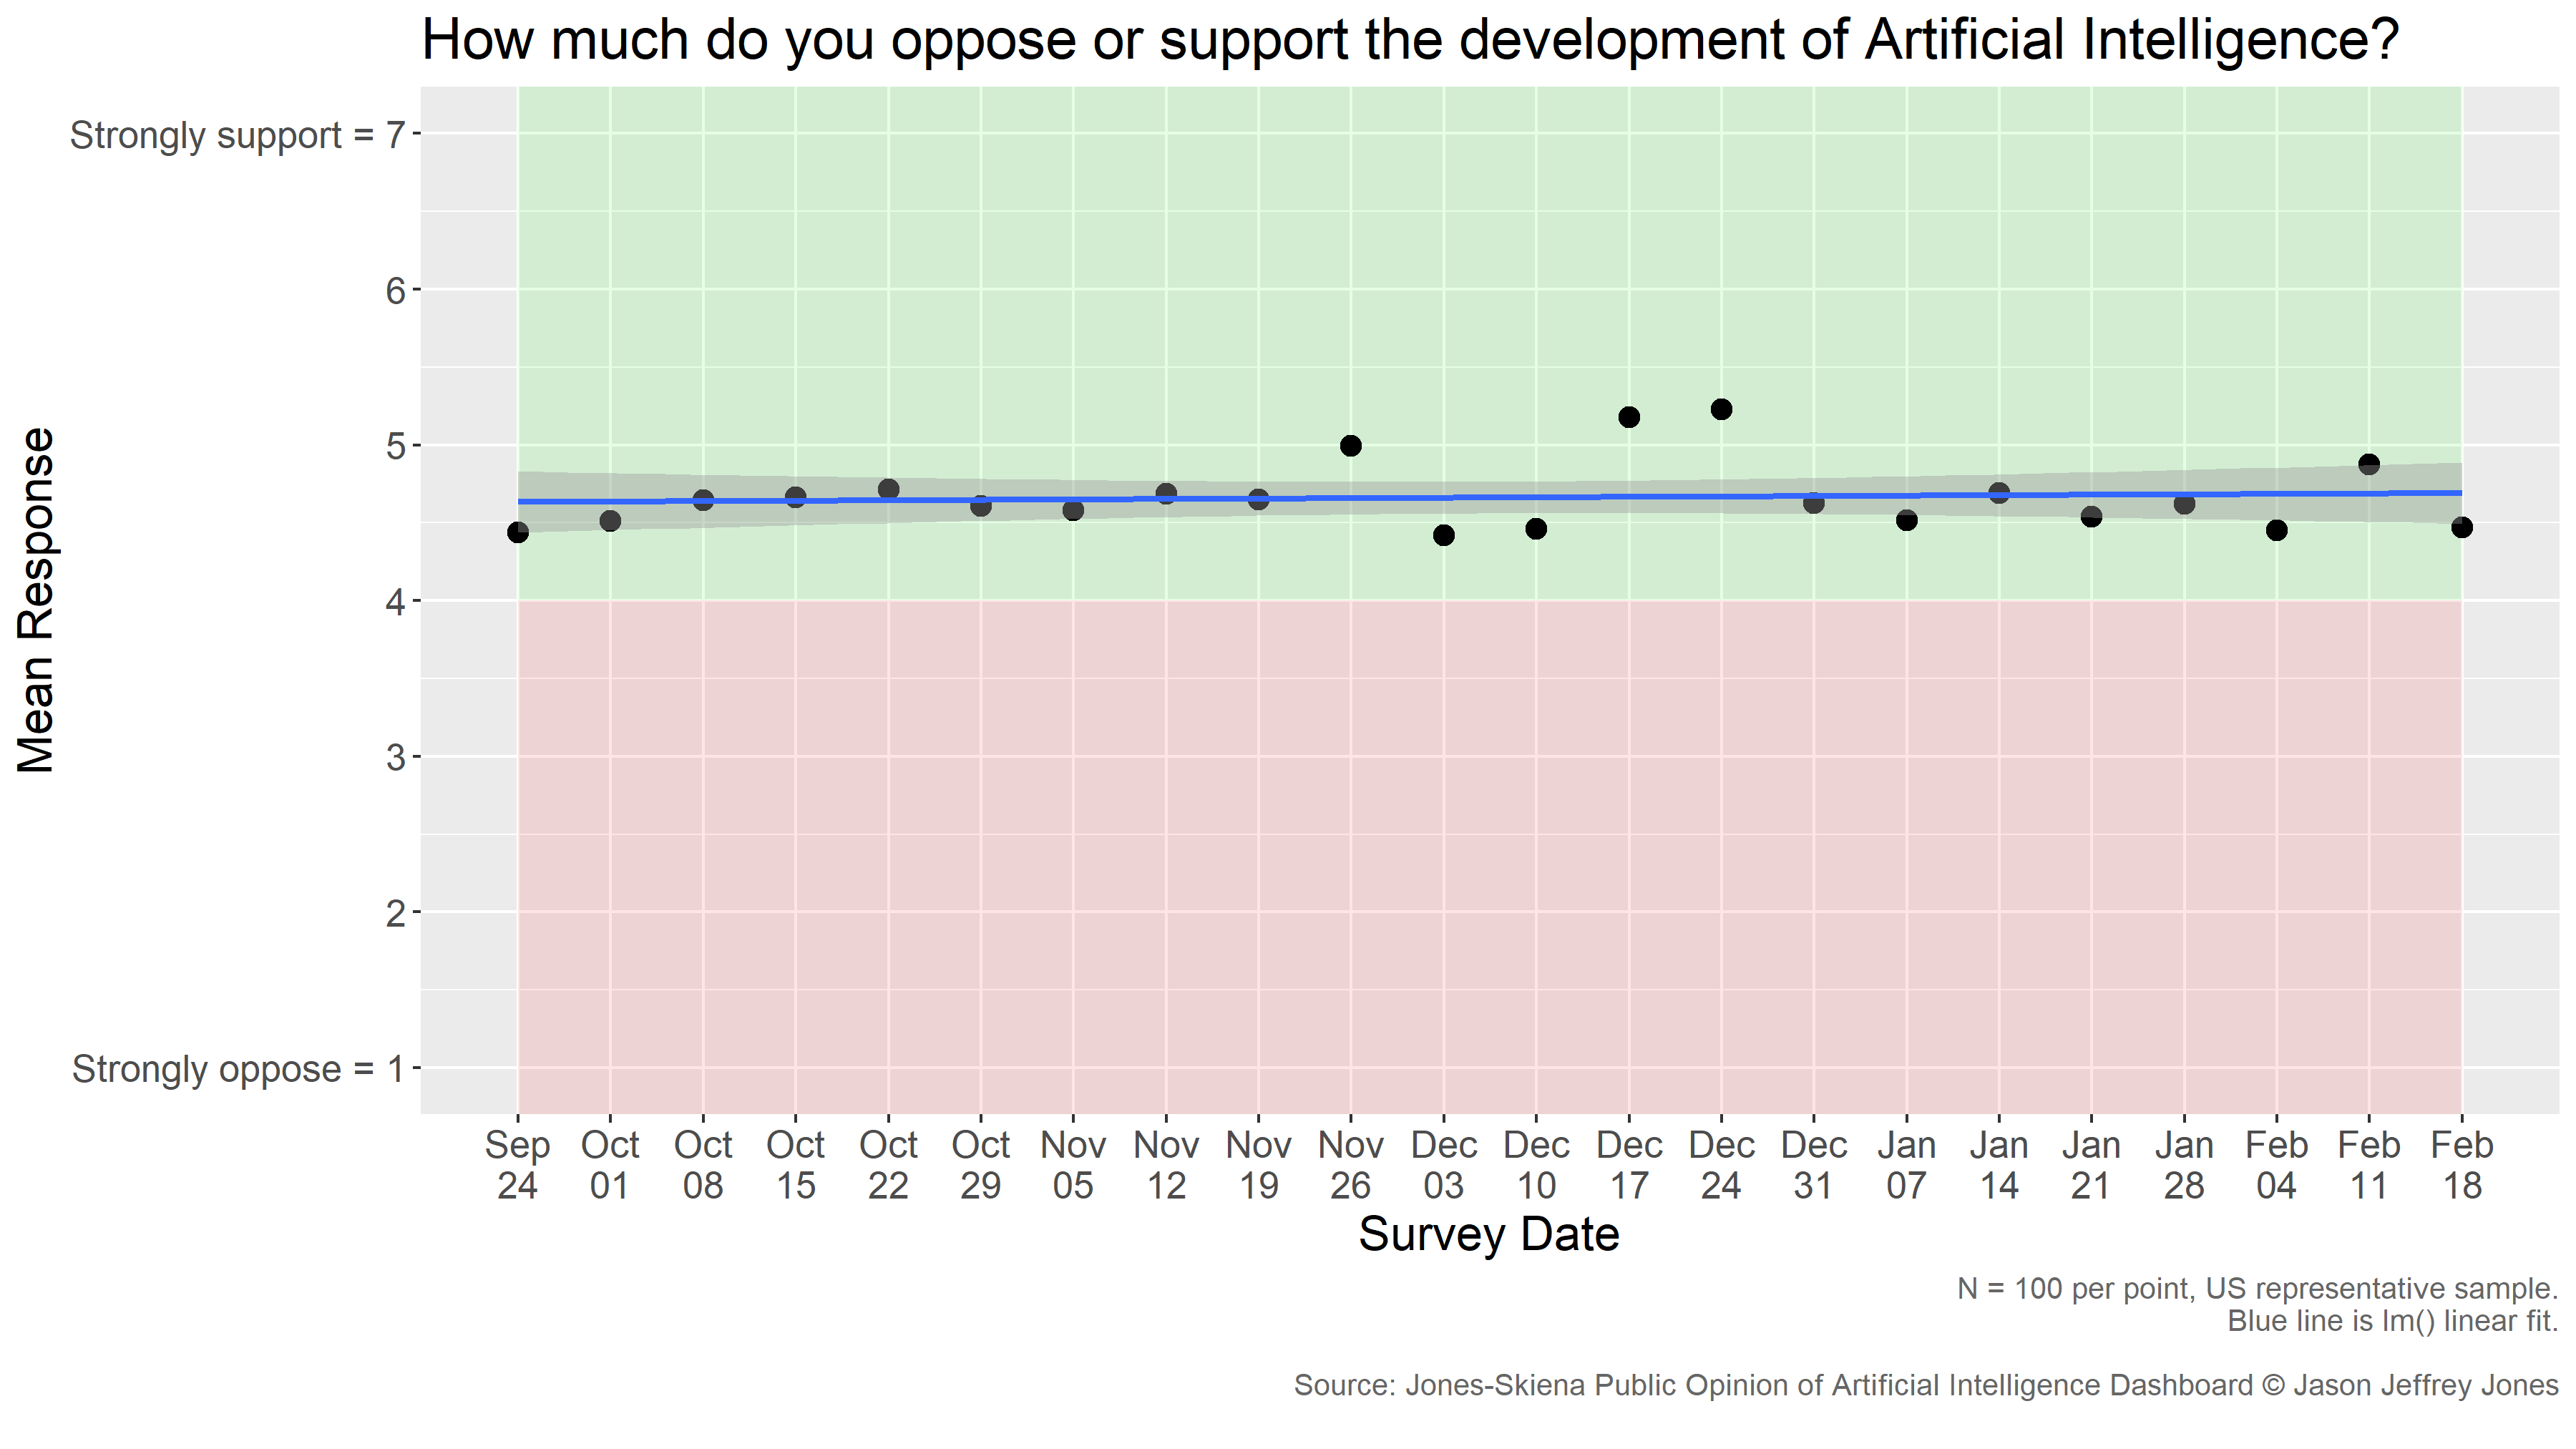
How much do you oppose or support the development of Artificial Intelligence?
The mean response per week and a linear trend are presented below.
Interpretation
On average, the American public supports the development of Artificial Intelligence. In the data from February 18, 2021, the estimated mean response is 4.47, with a 95% confidence interval of 4.10-4.84. On our 7-point scale (labeled "Strongly oppose" at one end and "Strongly support" at the other) a value of 4 indicates indifference, any value below that opposition and any point above support.
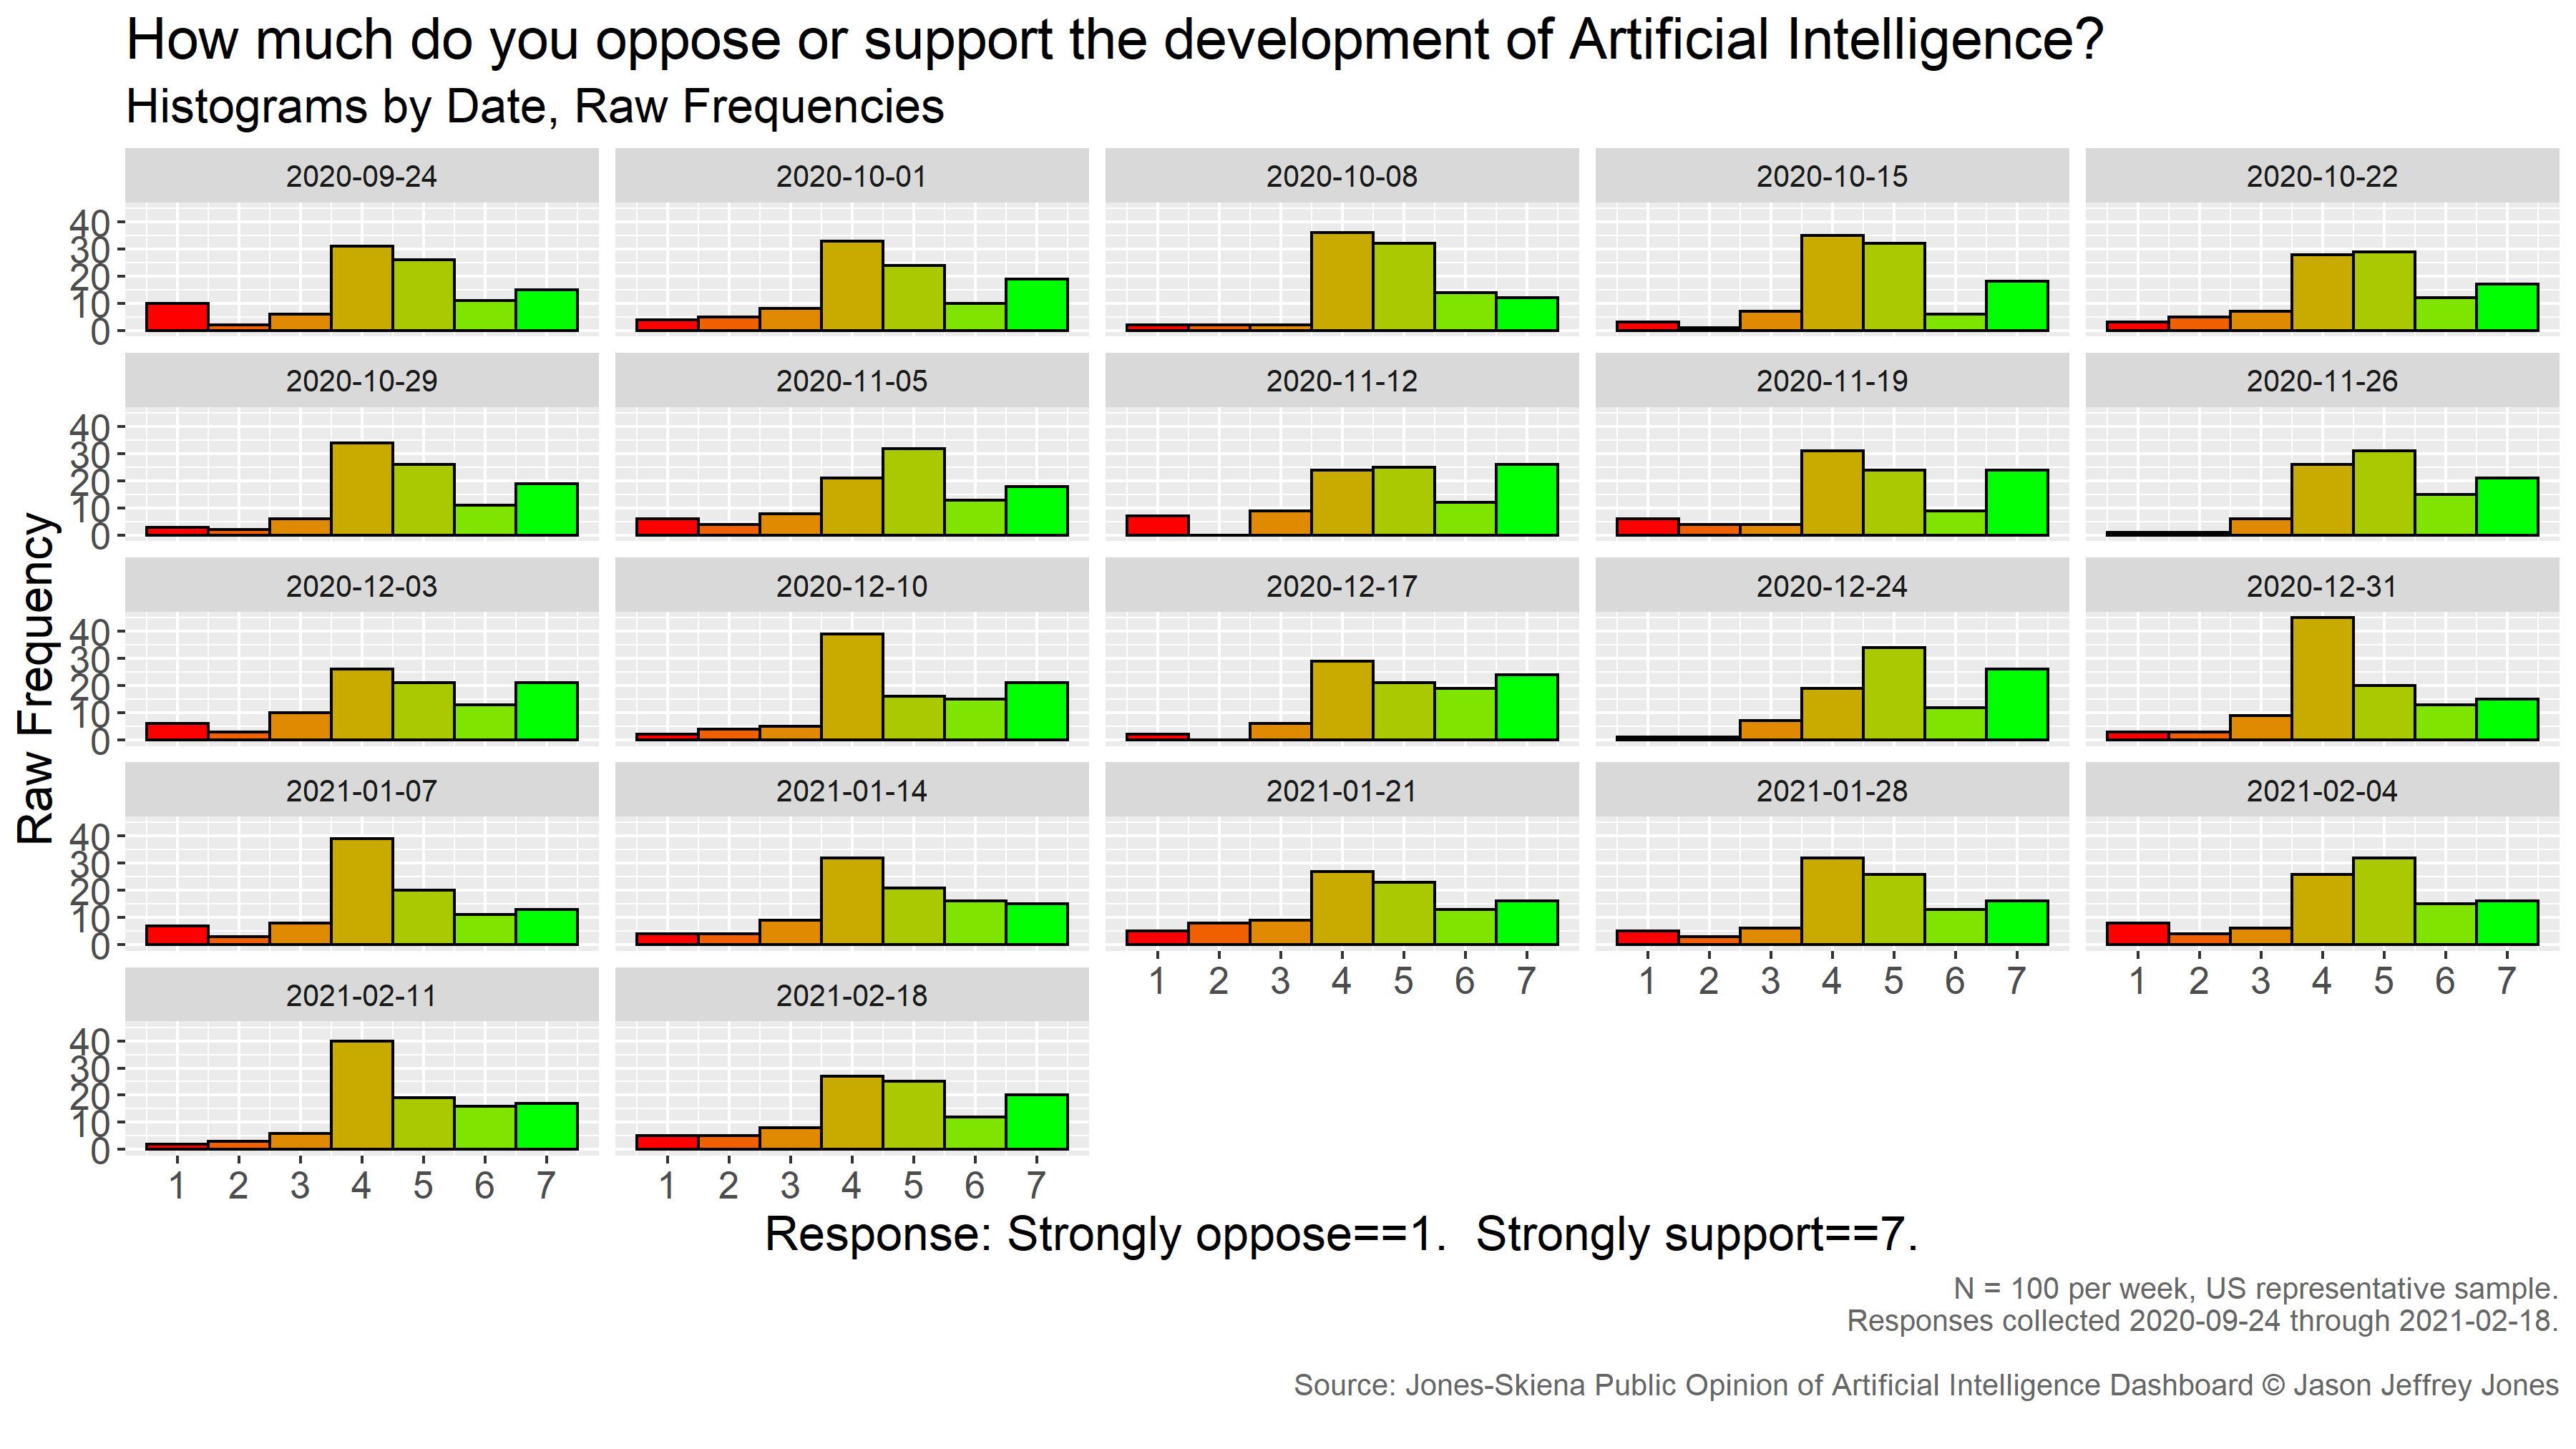
In 22 weeks of running the same survey item, we have never observed a mean estimate below the midpoint of the scale. However, it is useful to observe the raw frequency of responses as a set of histograms. One can see that the modal (most frequent) response is typically 4, the midpoint of the scale, which we interpret as indifference. Americans are generally neutral on this question, but among those who are not, there are more on the Support end of the scale than the Oppose end. One can reasonably question whether the observed modal indifference is a stable equilibrium. We imagine that it is not, and public support will shift in one direction or another as more Americans gain more experience with and knowledge of artificial intelligence. However, we have been expecting that for awhile now, only to be met by brutal sameness week after week.
Currently, the data point toward stable support. A linear fit of mean estimates over weeks returns a slope not statistically significantly different from zero.
Confidence in Groups using Artificial Intelligence
NEW DATA! Updated 2021-02-22.
We deliver items of the following form every month to a random, representative sample of 100 Americans:
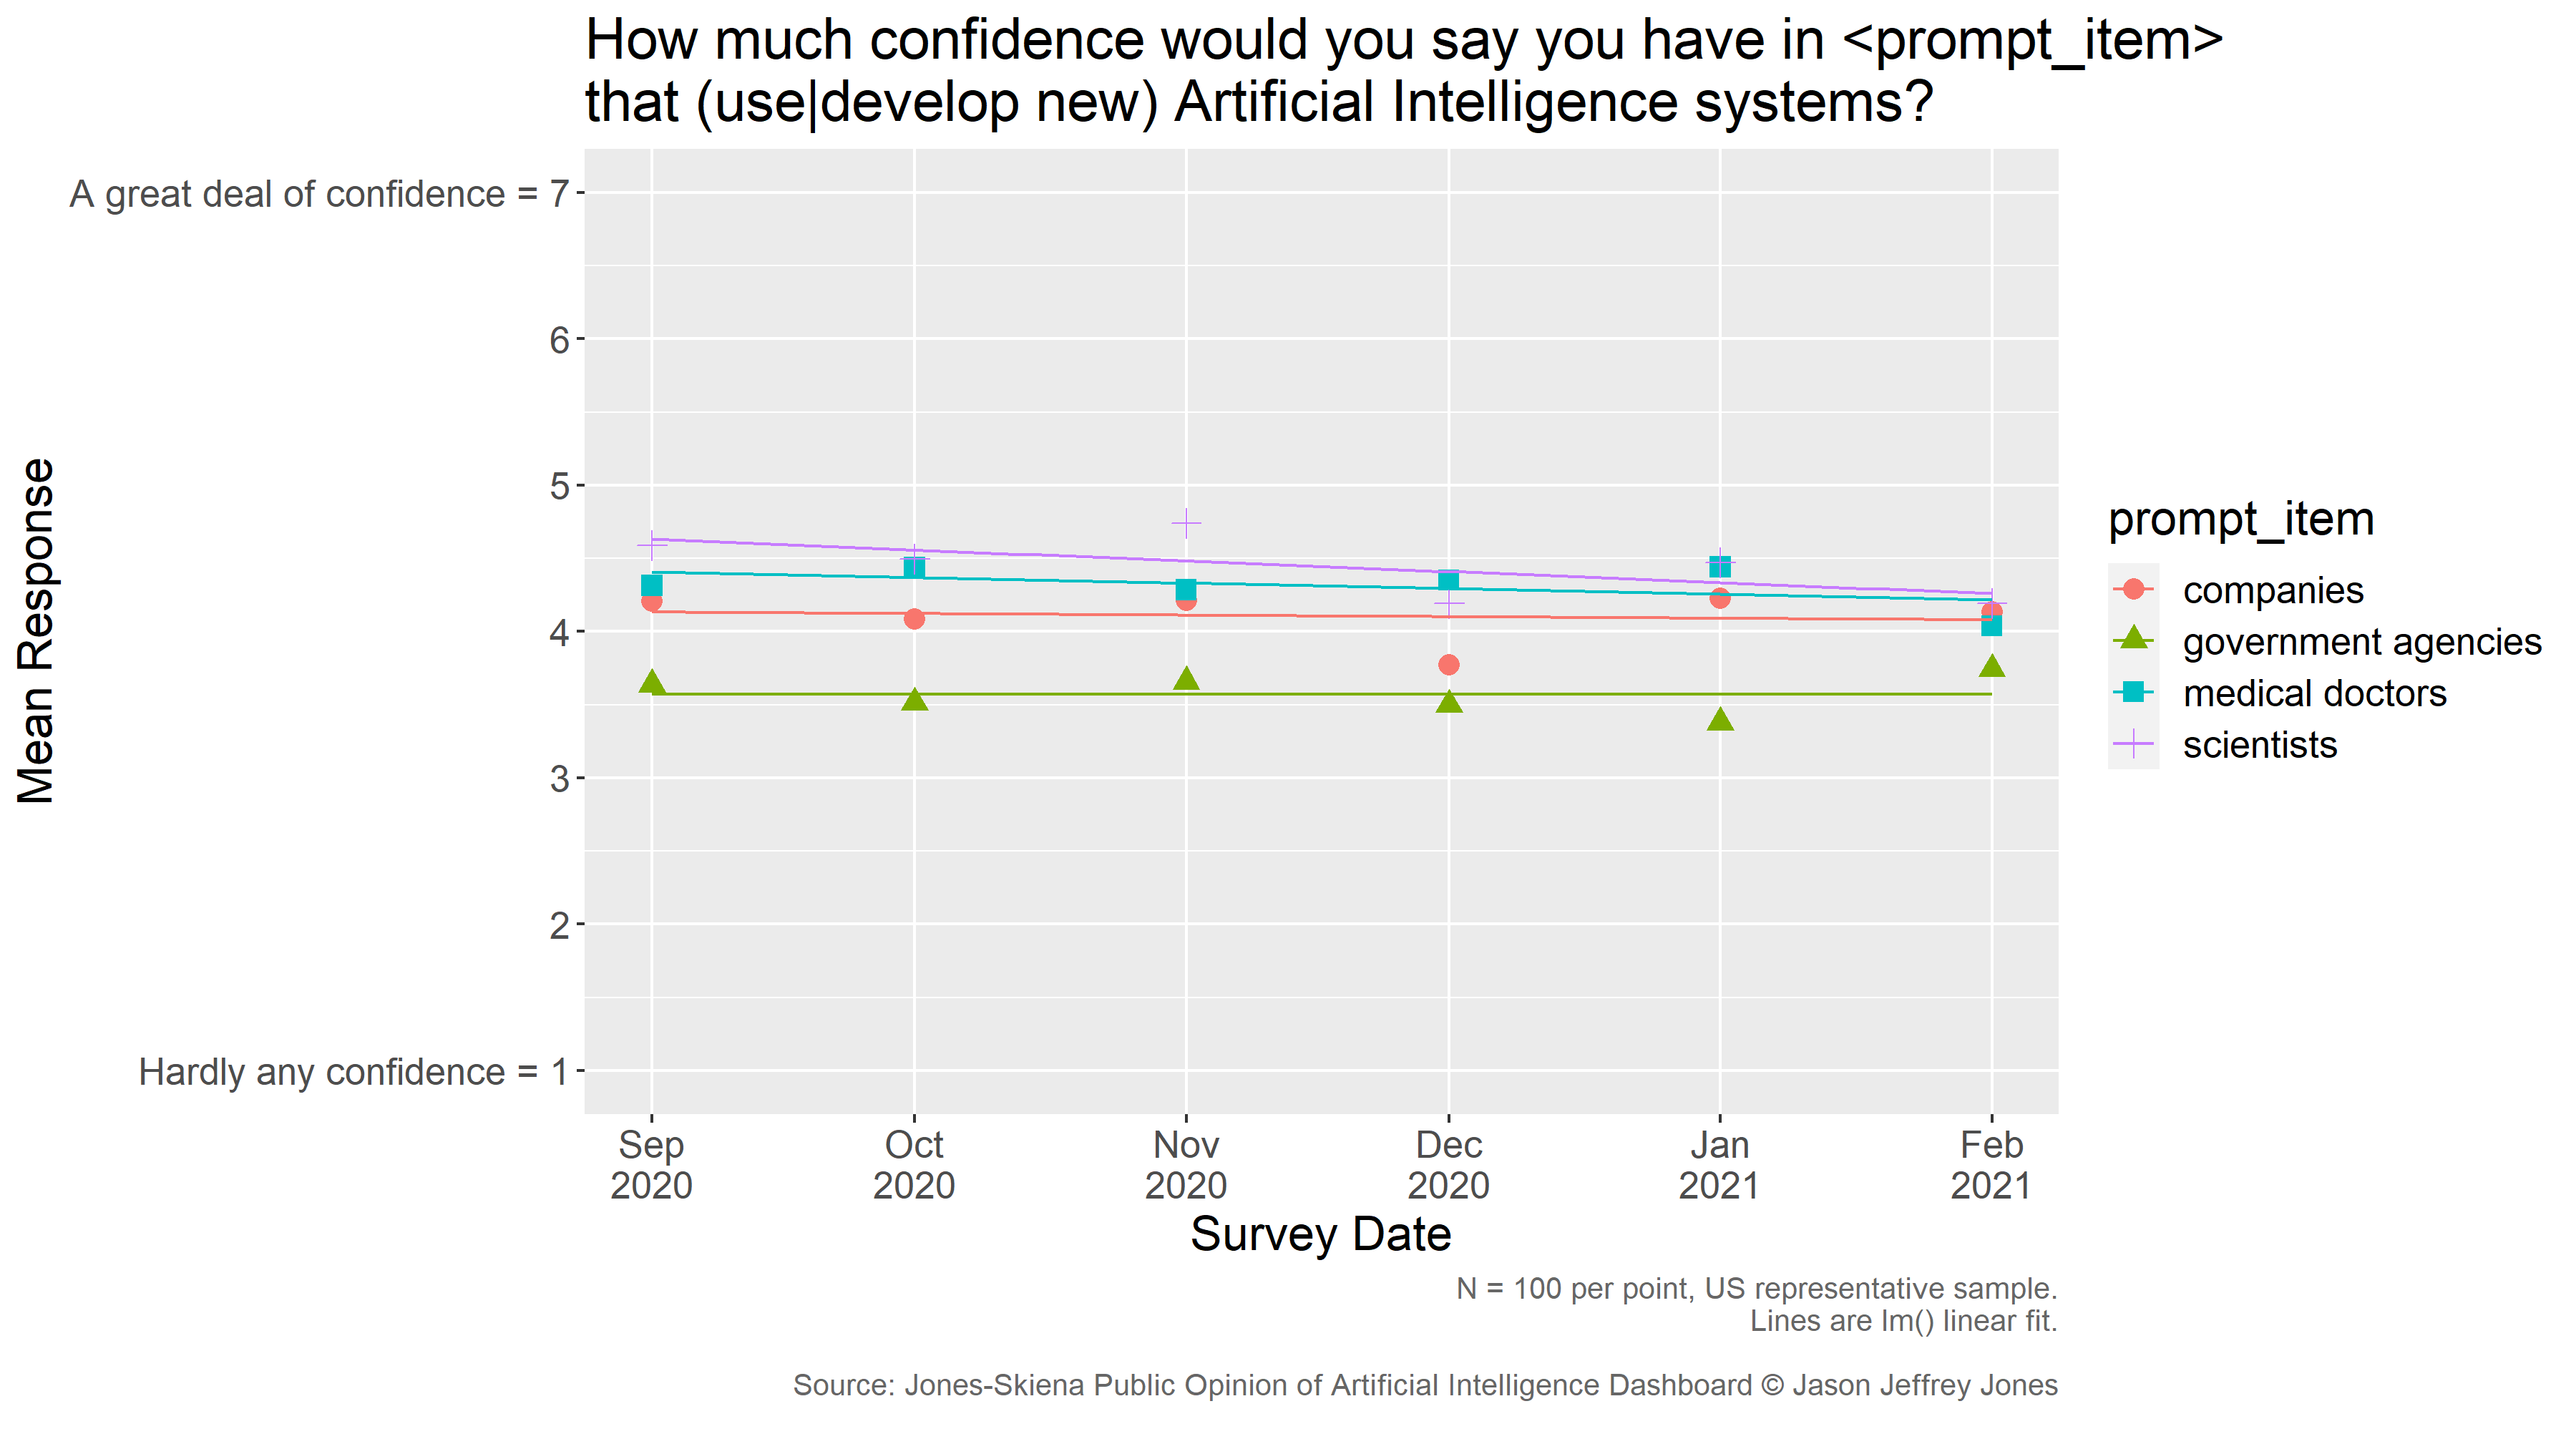
How much confidence would you say you have in <prompt-items> that use Artificial Intelligence systems?
The mean response per month and a linear trend are presented below.
Interpretation
On average, the American public has middling confidence in groups that use Artificial Intelligence. There is plenty of room on the scale for respondents to indicate they have less confidence or more, but the responses point to sustained intermediate levels of confidence, or perhaps indifference.
In our early data (Sep-Nov 2020), scientists that develop new Artificial Intelligence systems appeared to consistently elicit more confidence than other items. The series also indicated it might be increasing (weak positive slope). However, with the most recent three rounds of data, confidence in AI scientists has slumped back toward the pack. No item appears to be steadily gaining or losing confidence. Trendlines are shown to aid the eye, but none has a slope significantly different from zero. (The downward trend for confidence in scientists is closest to statistical significance at p = 0.15.)
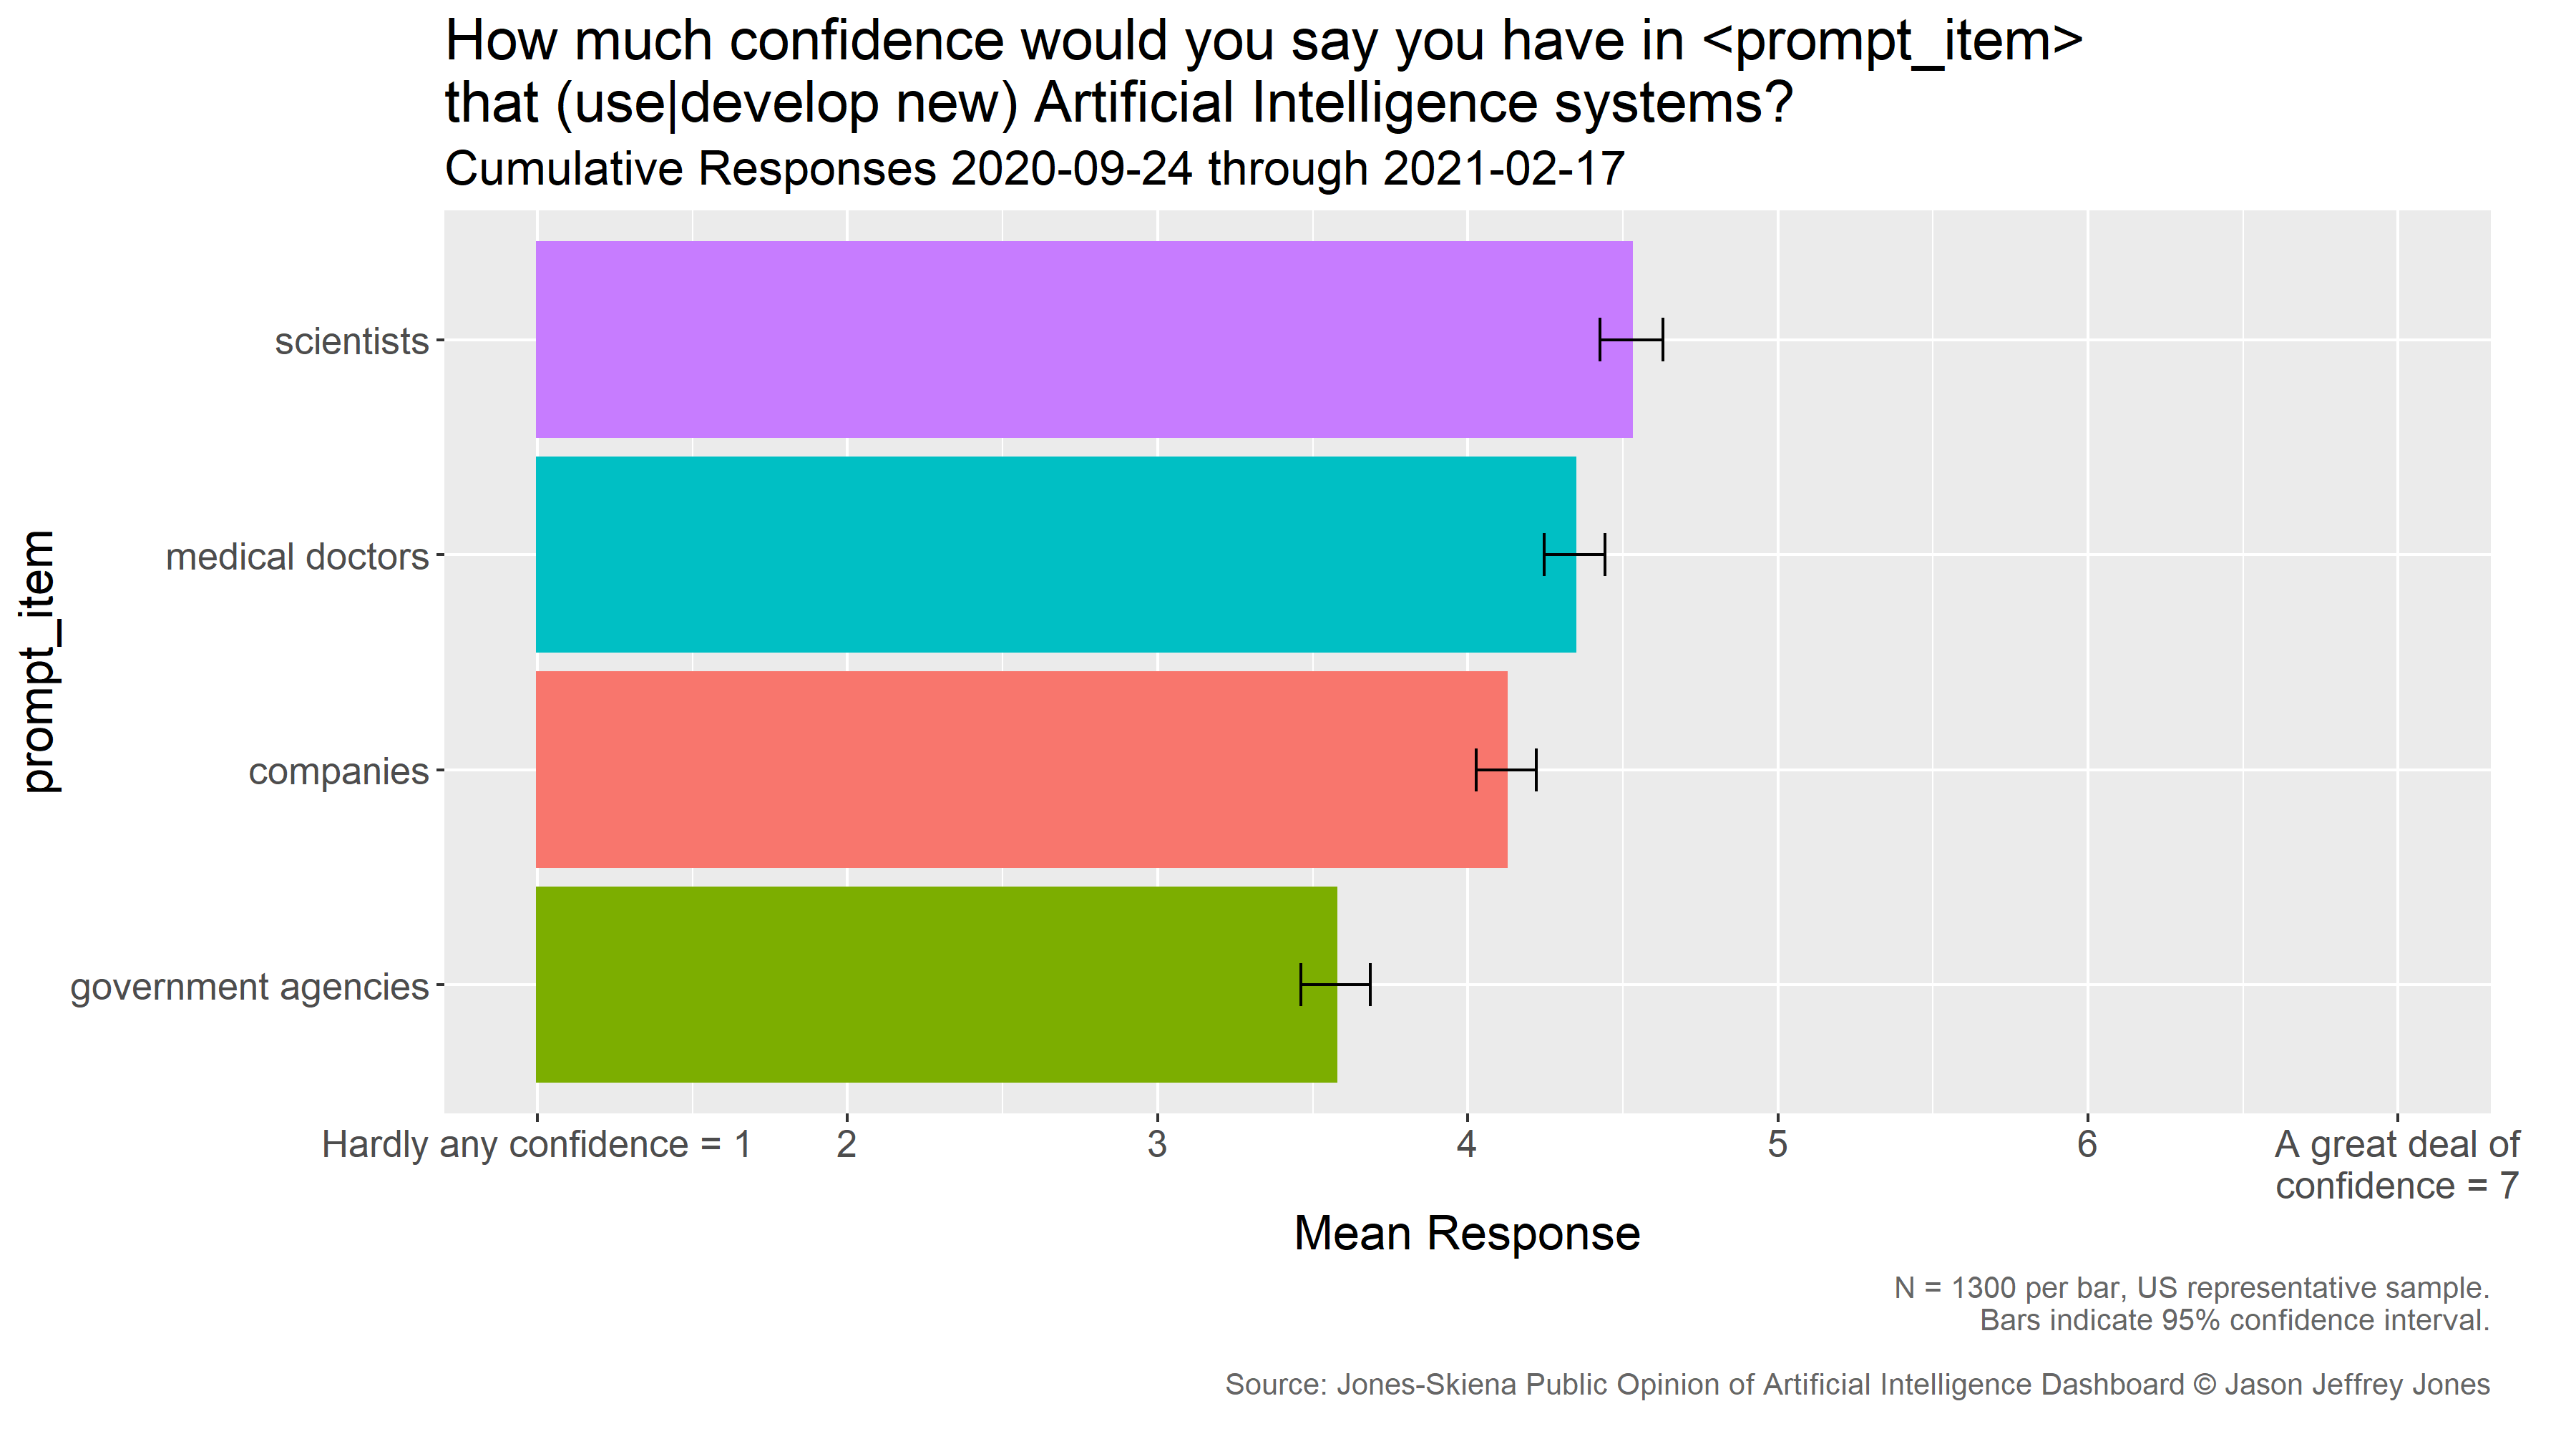
The figure below contrasts the means for each prompt item, collapsing across all dates. One can confidently conclude that overall, Americans place highest confidence in scientists to develop new artificial intelligence systems, followed by medical doctors, companies and government agencies to use these systems.
Familiarity with Artificial Intelligence
Updated 2021-02-15.
We deliver items of the following form every month to a random, representative sample of 100 Americans:
How familiar are you with the following computer-related item? <prompt-item>
The mean response per month and a linear trend are presented below.
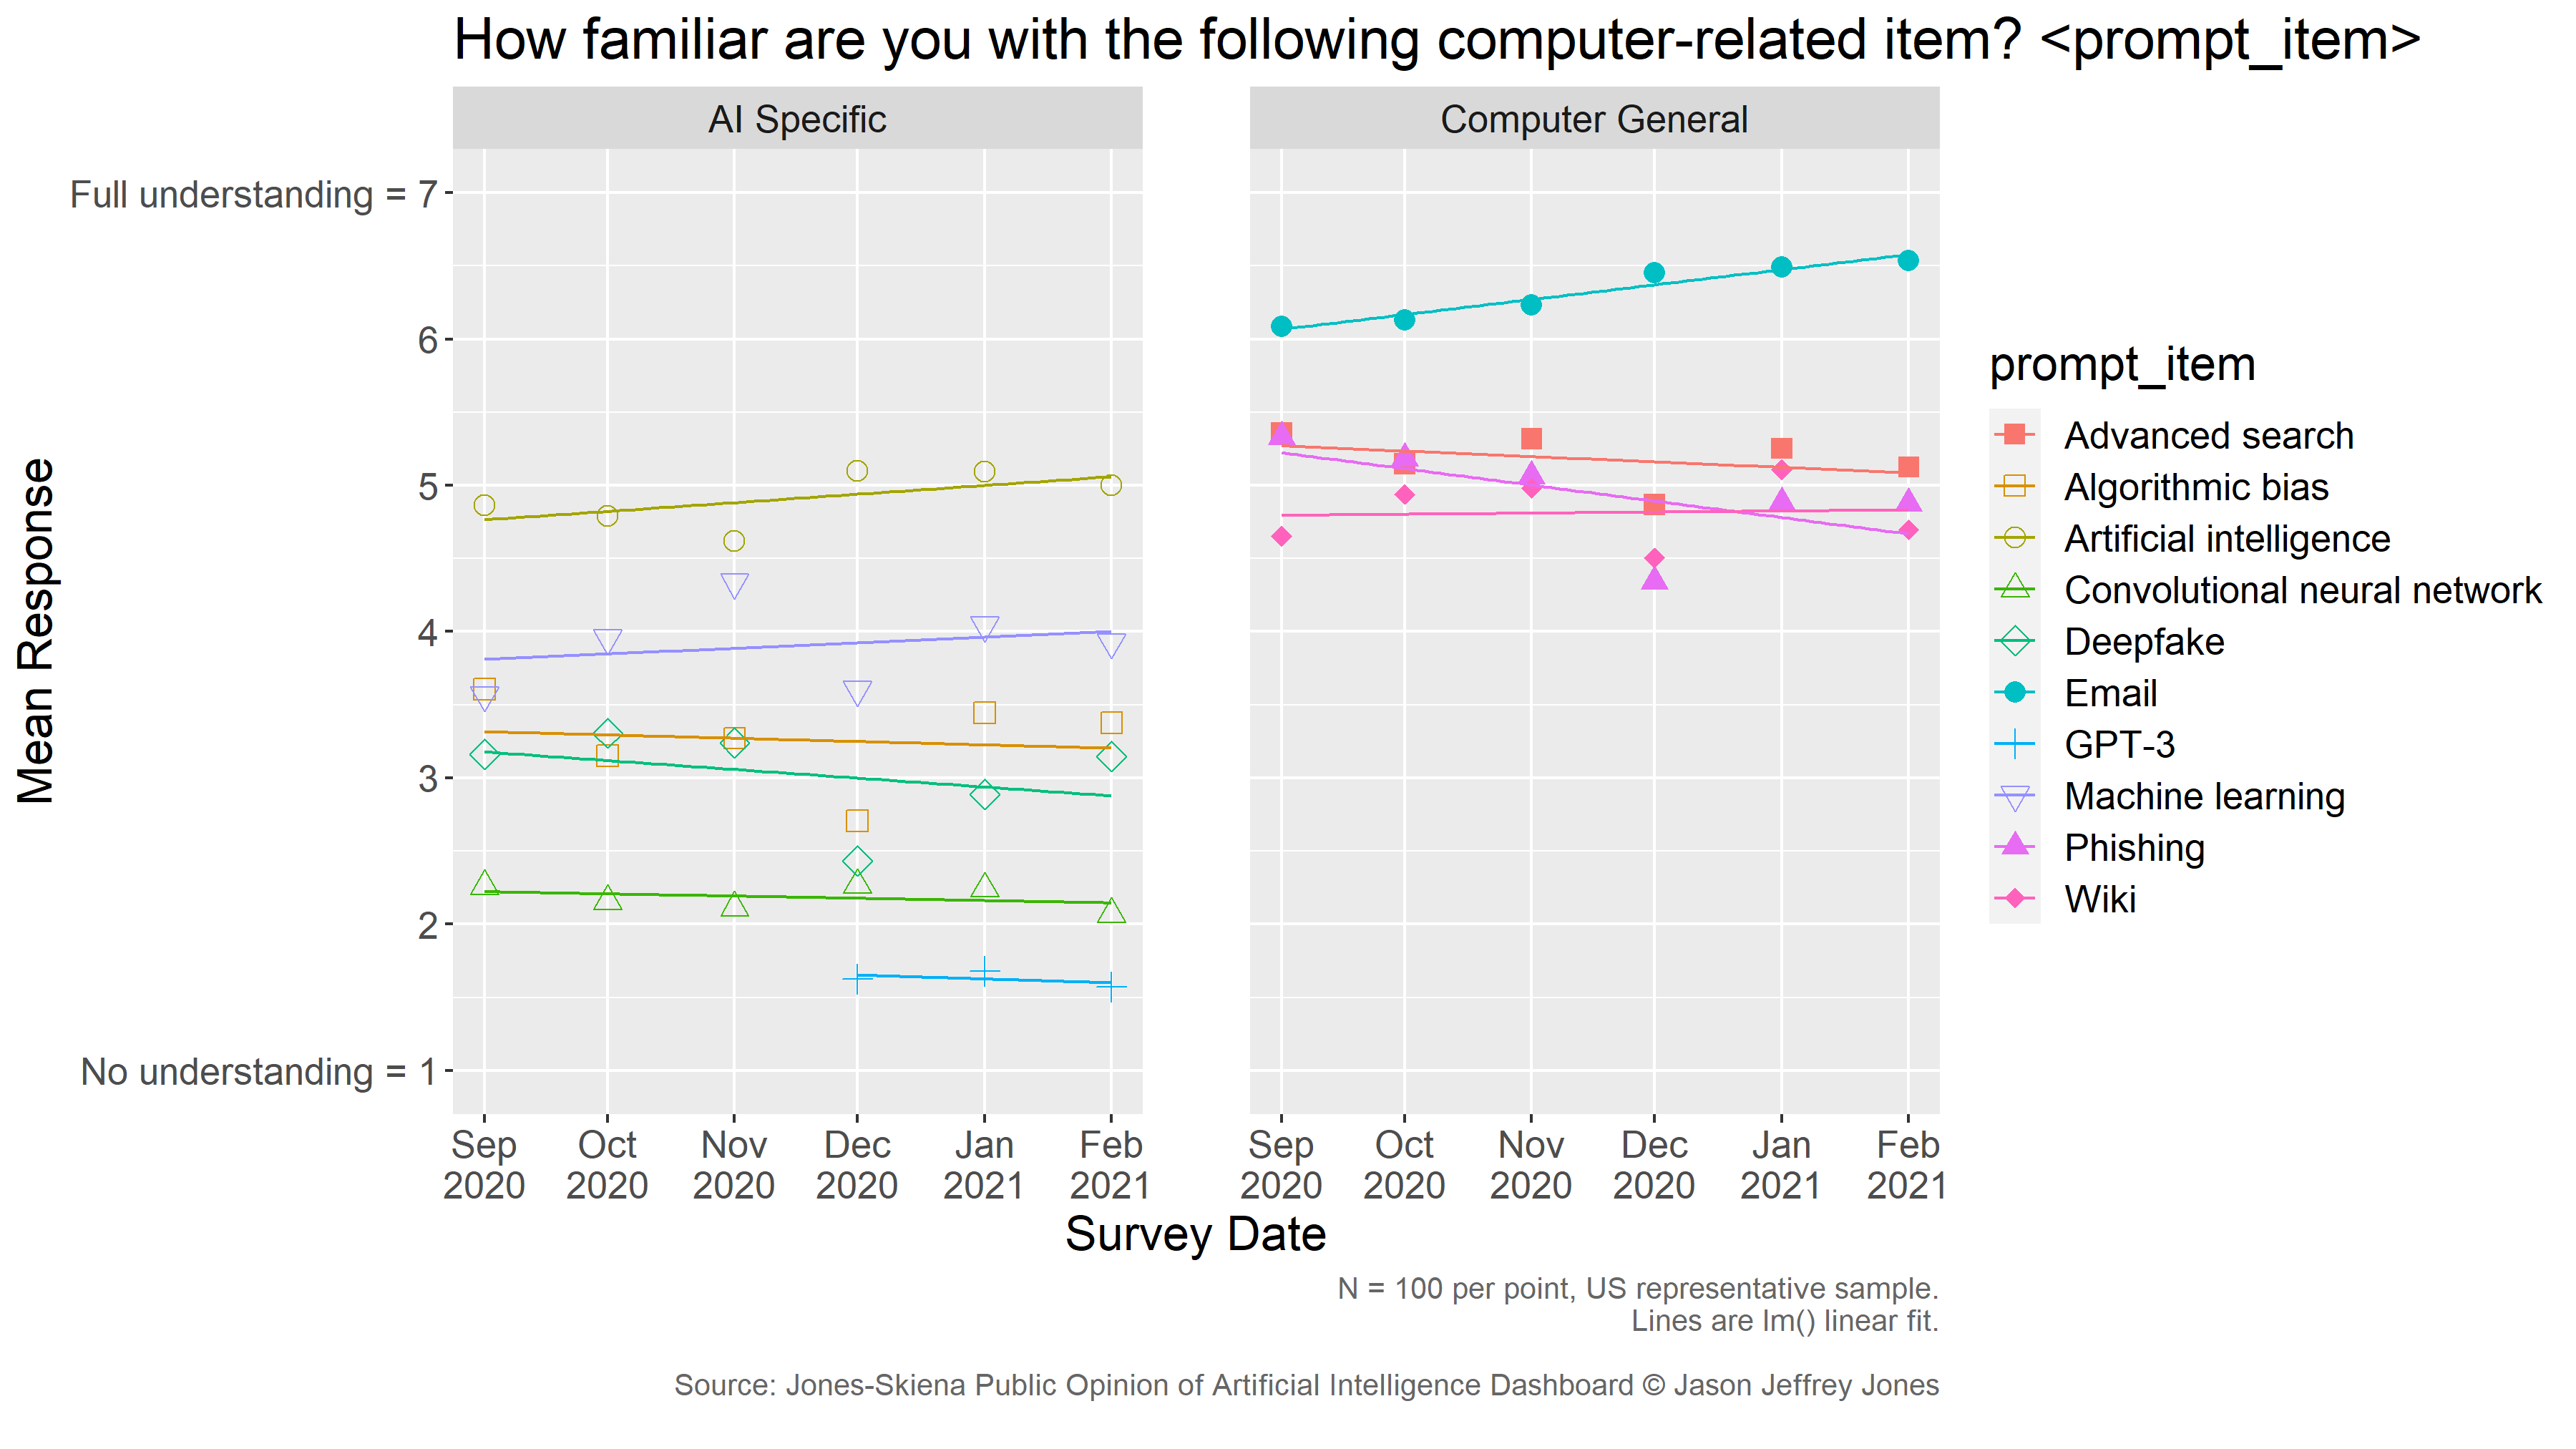
Interpretation
Are Americans really still on the learning curve for email? It is hard to believe, but that is what the data say. The positive slope of the regression line is statistically significant for Email, p = 0.001. That is the strongest temporal trend present in the results.
On average, the American public self-reports less understanding of Artificial Intellgience terms as compared to other computer terms. That split is apparent by the separation of the datapoints and trendlines above. It can be seen more clearly in the following visualization which pools the data for all survey rounds and estimates 95% confidence intervals for each item.
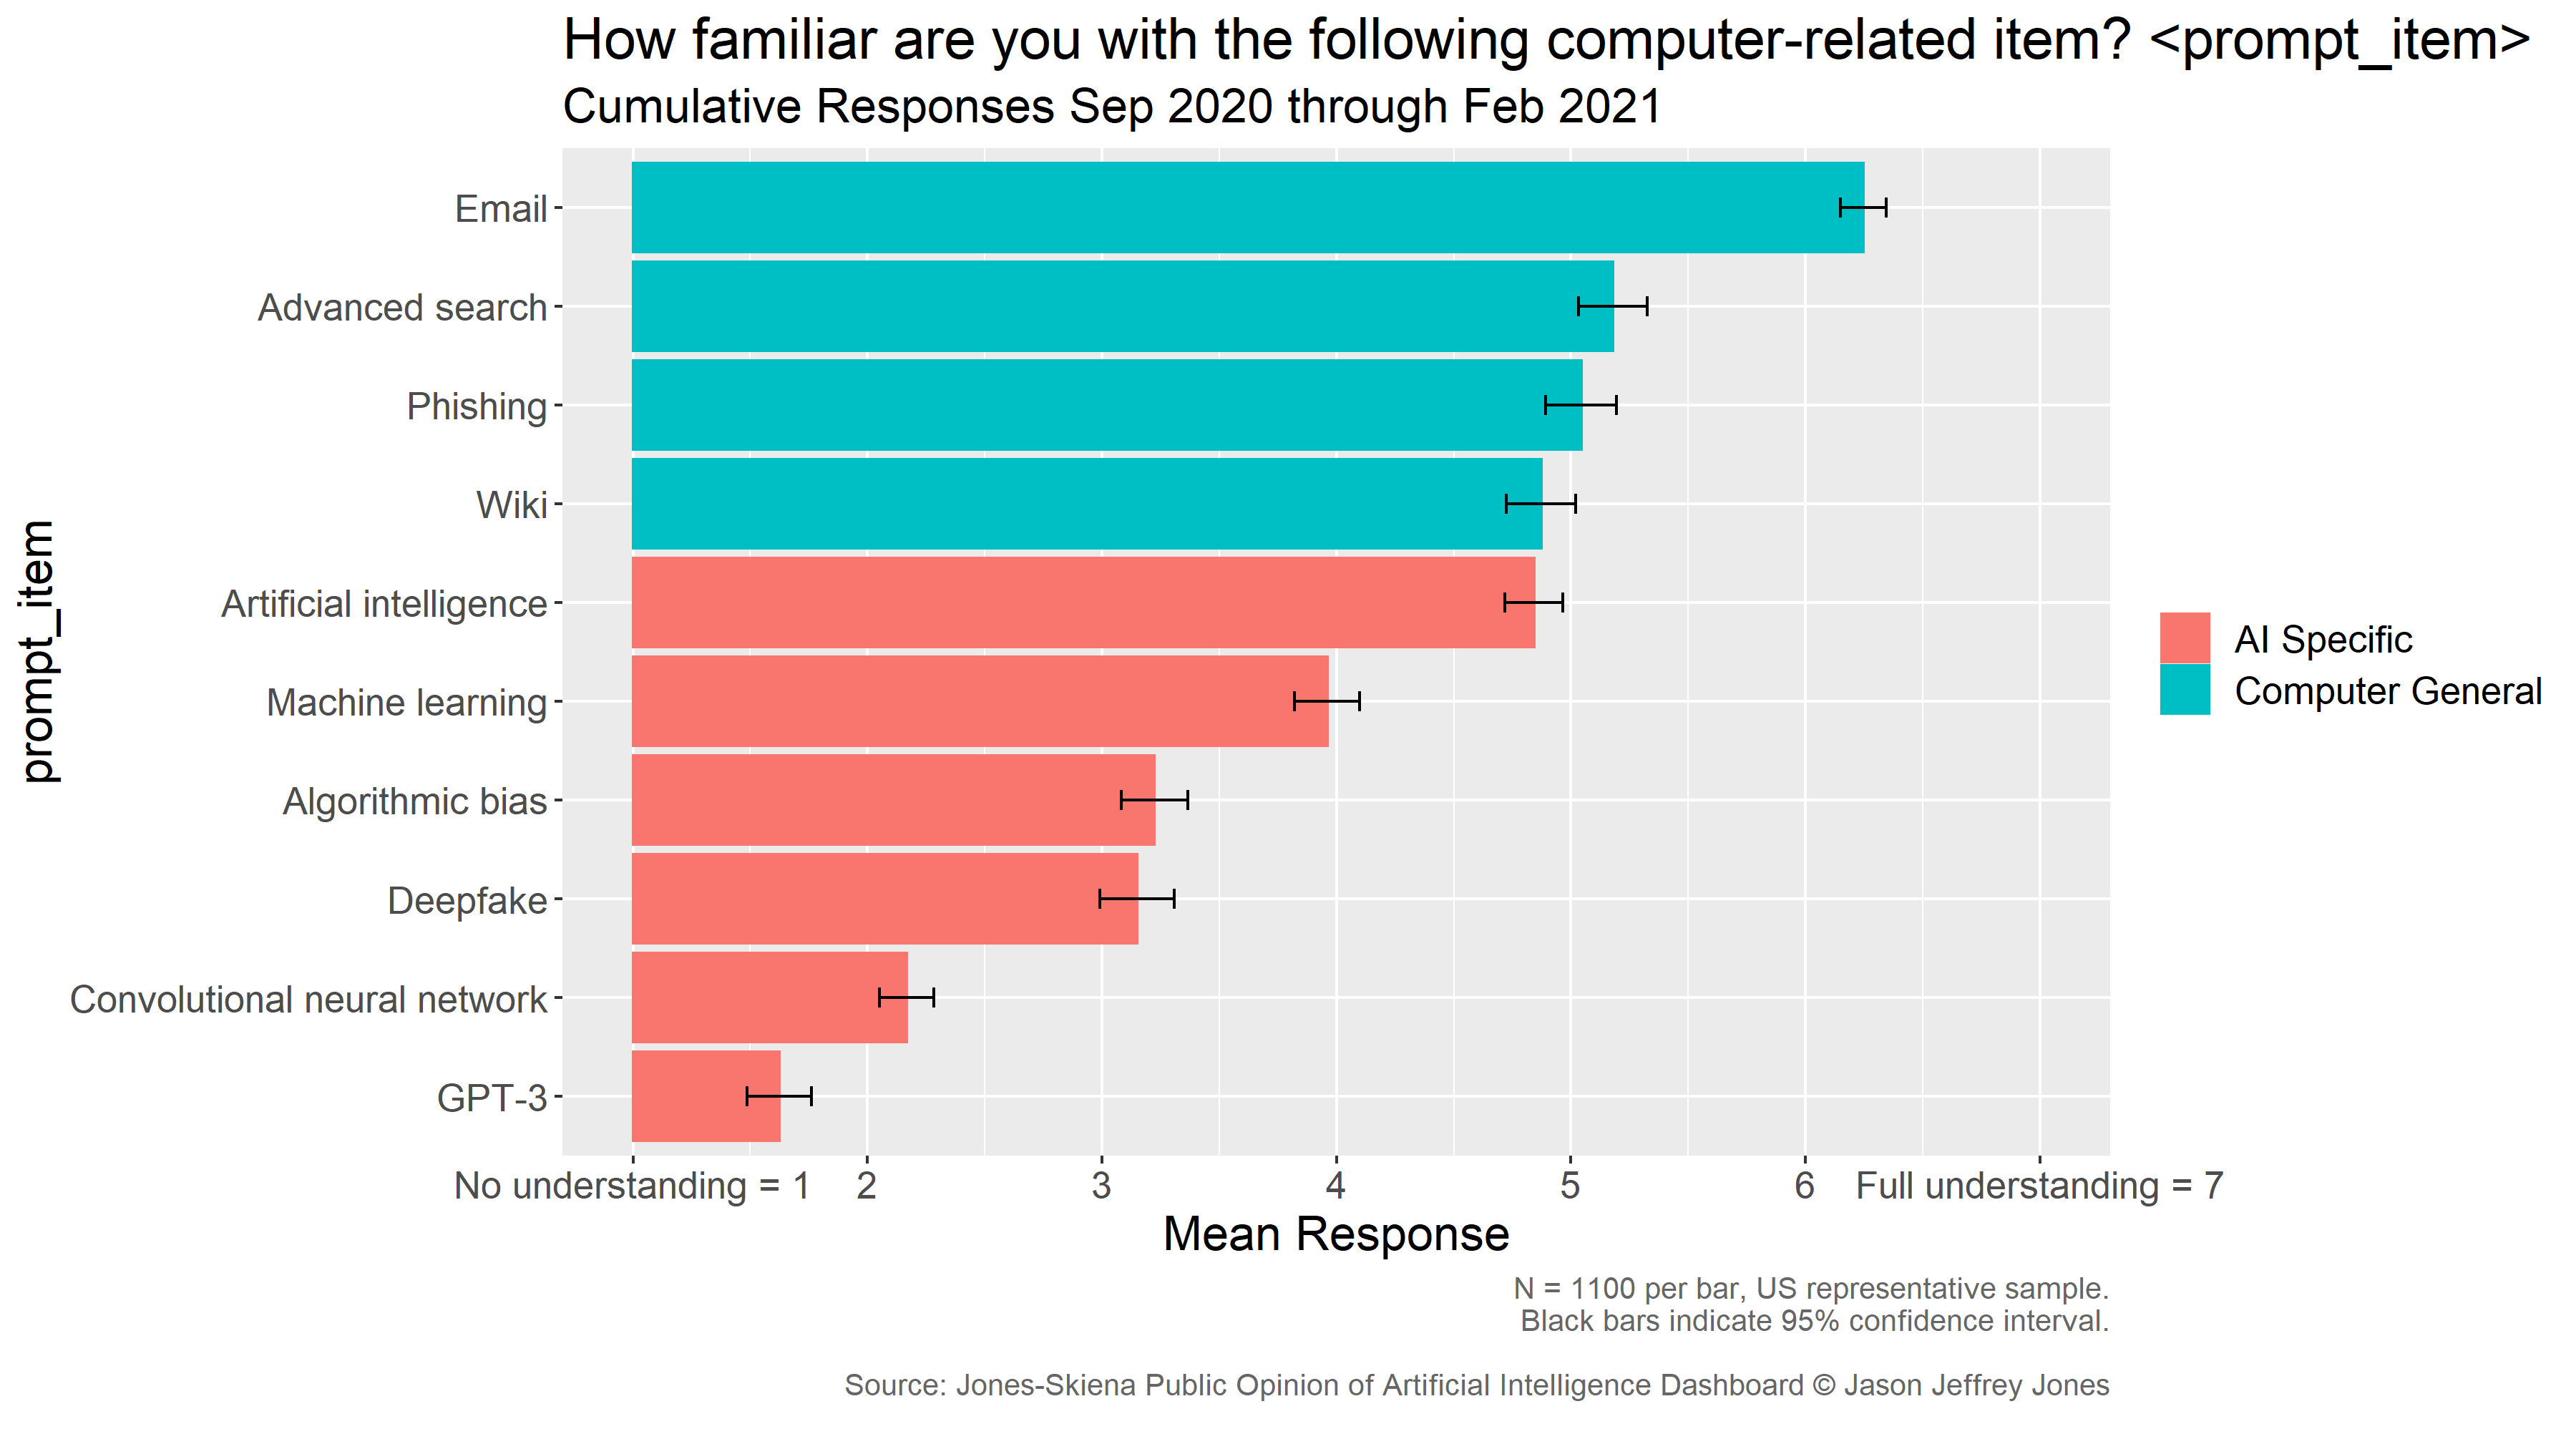
Americans report very low understanding of 'GPT-3' - an item we added in the December round. Despite the volume and intensity of recent discussion surrounding GPT-3 within AI circles, the broader public is not comfortable expressing any understanding of this item.
Trust in Artificial Intelligence
Updated 2021-02-08.
We deliver items of the following form every month to a random, representative sample of 100 Americans:
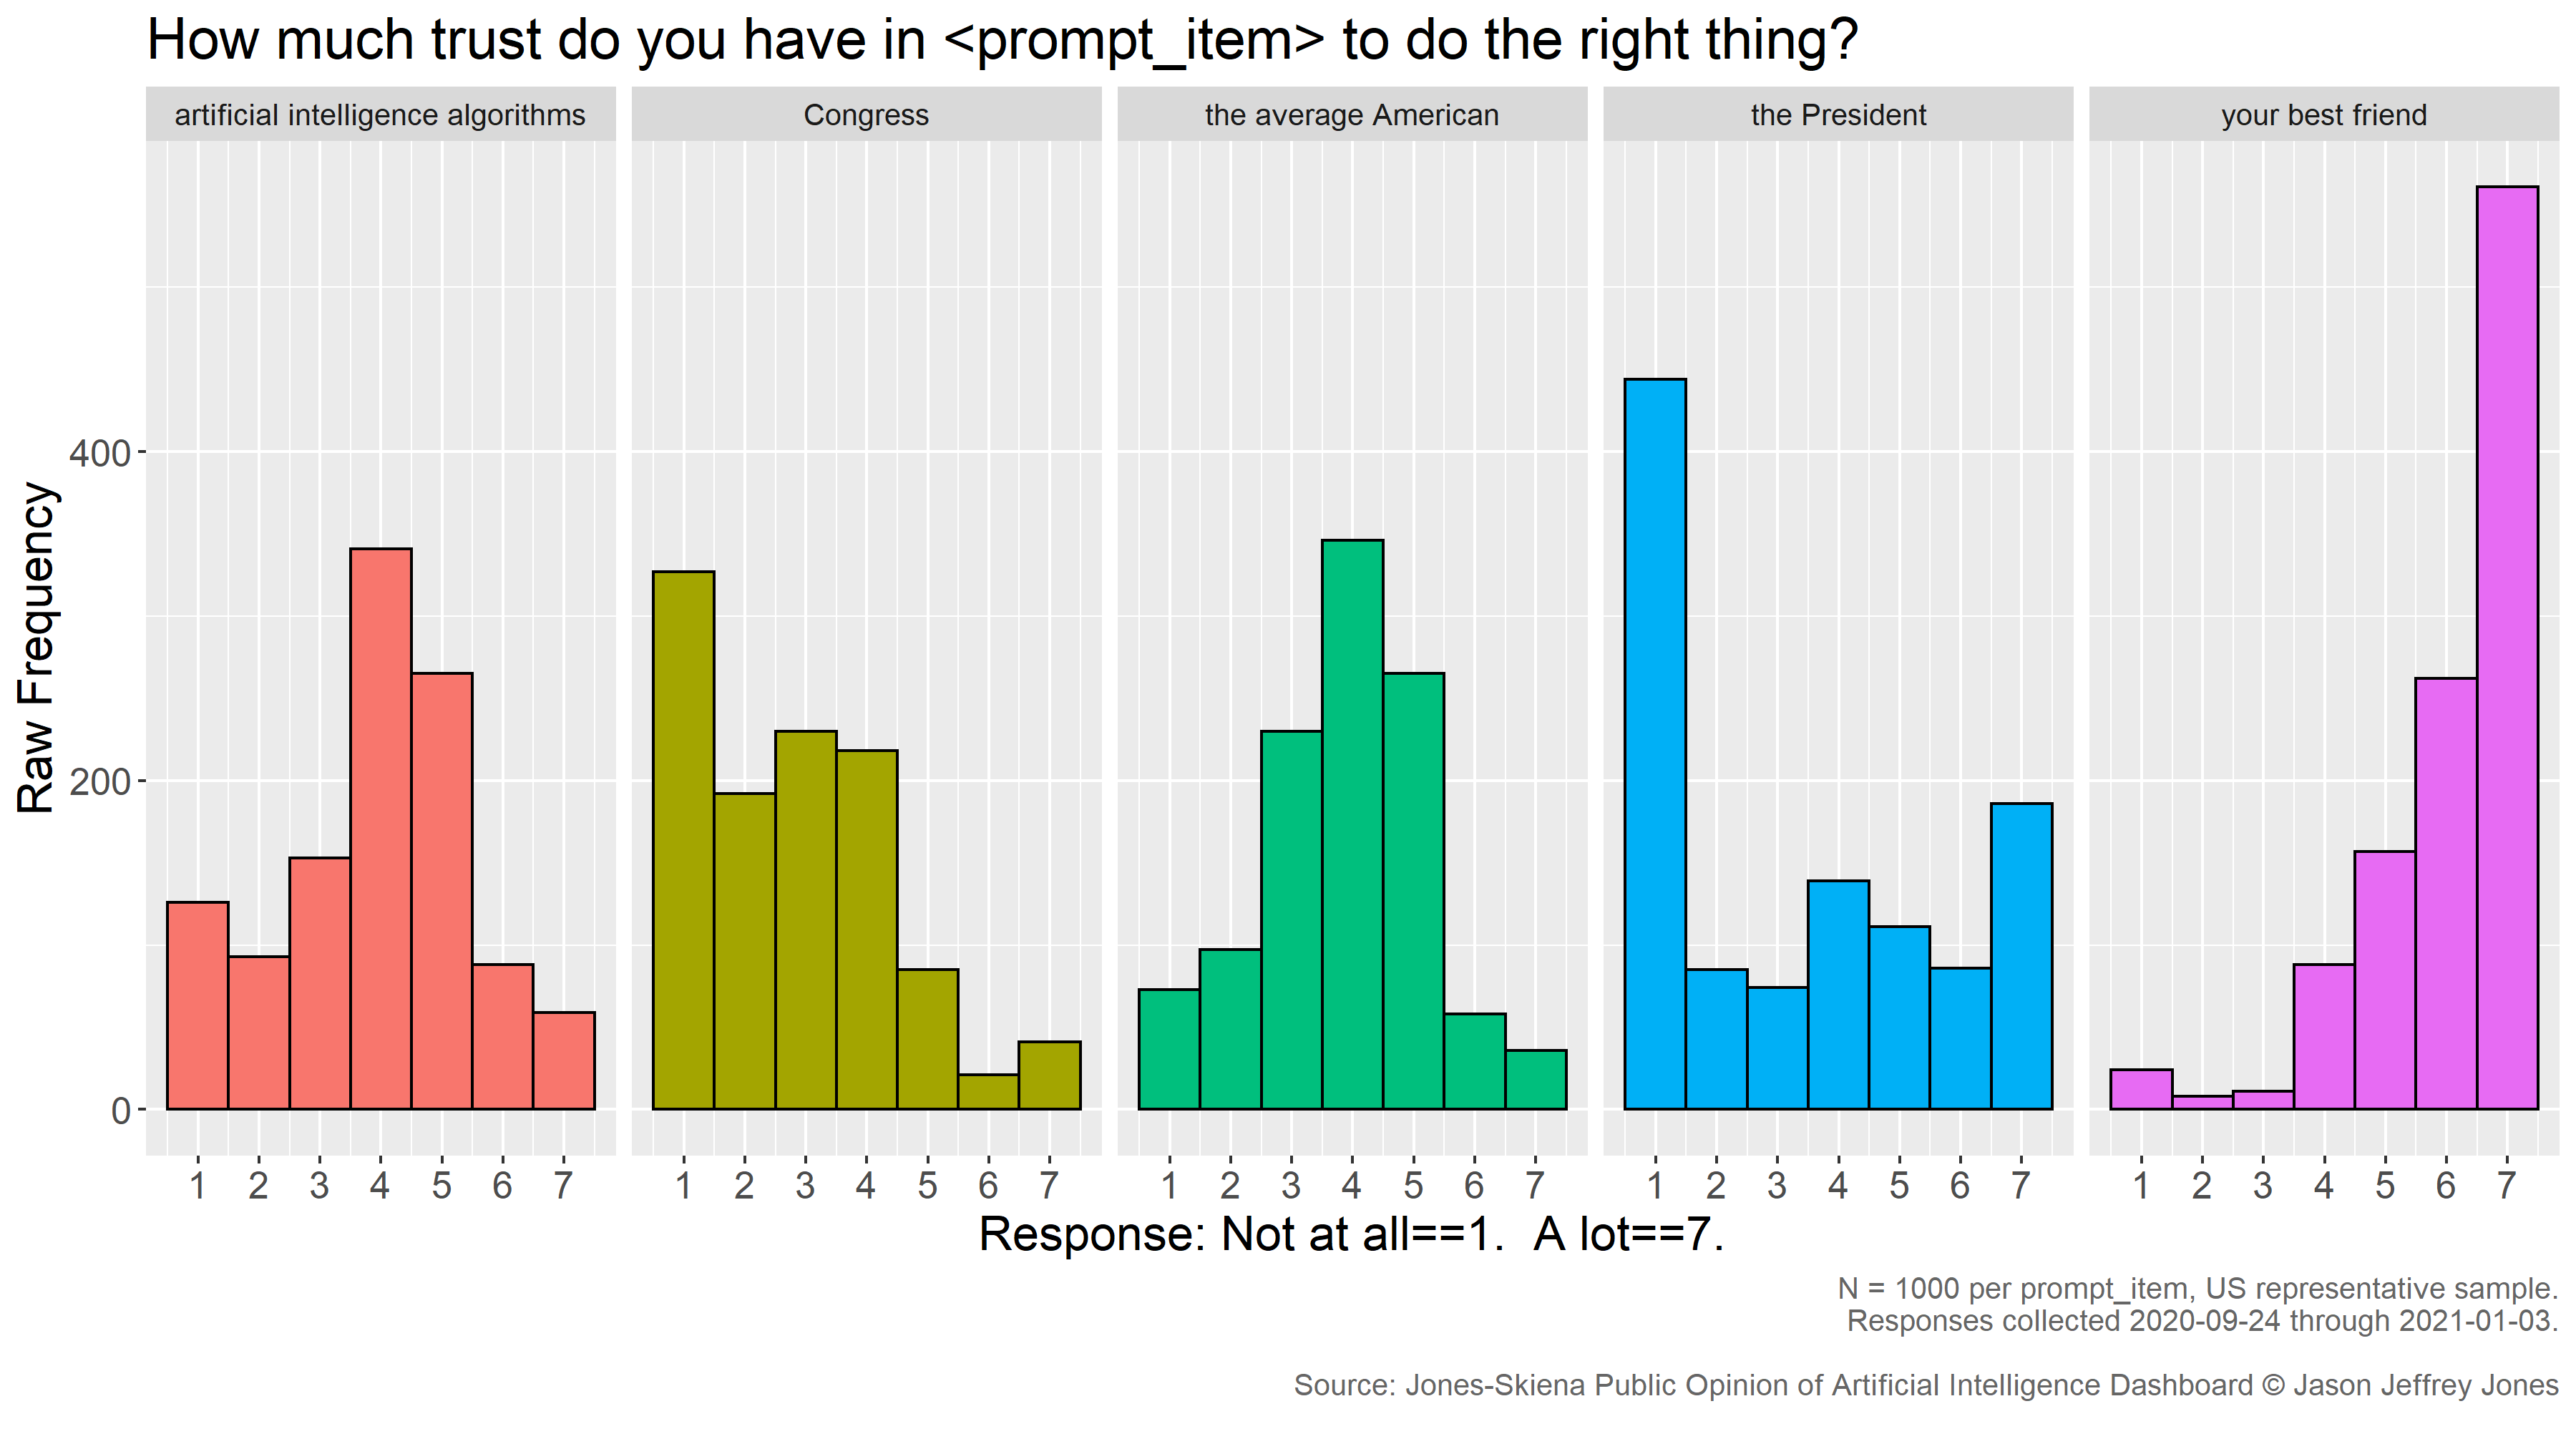
How much trust do you have in <prompt-item> to do the right thing?
The mean response per week and a linear trend are presented below.
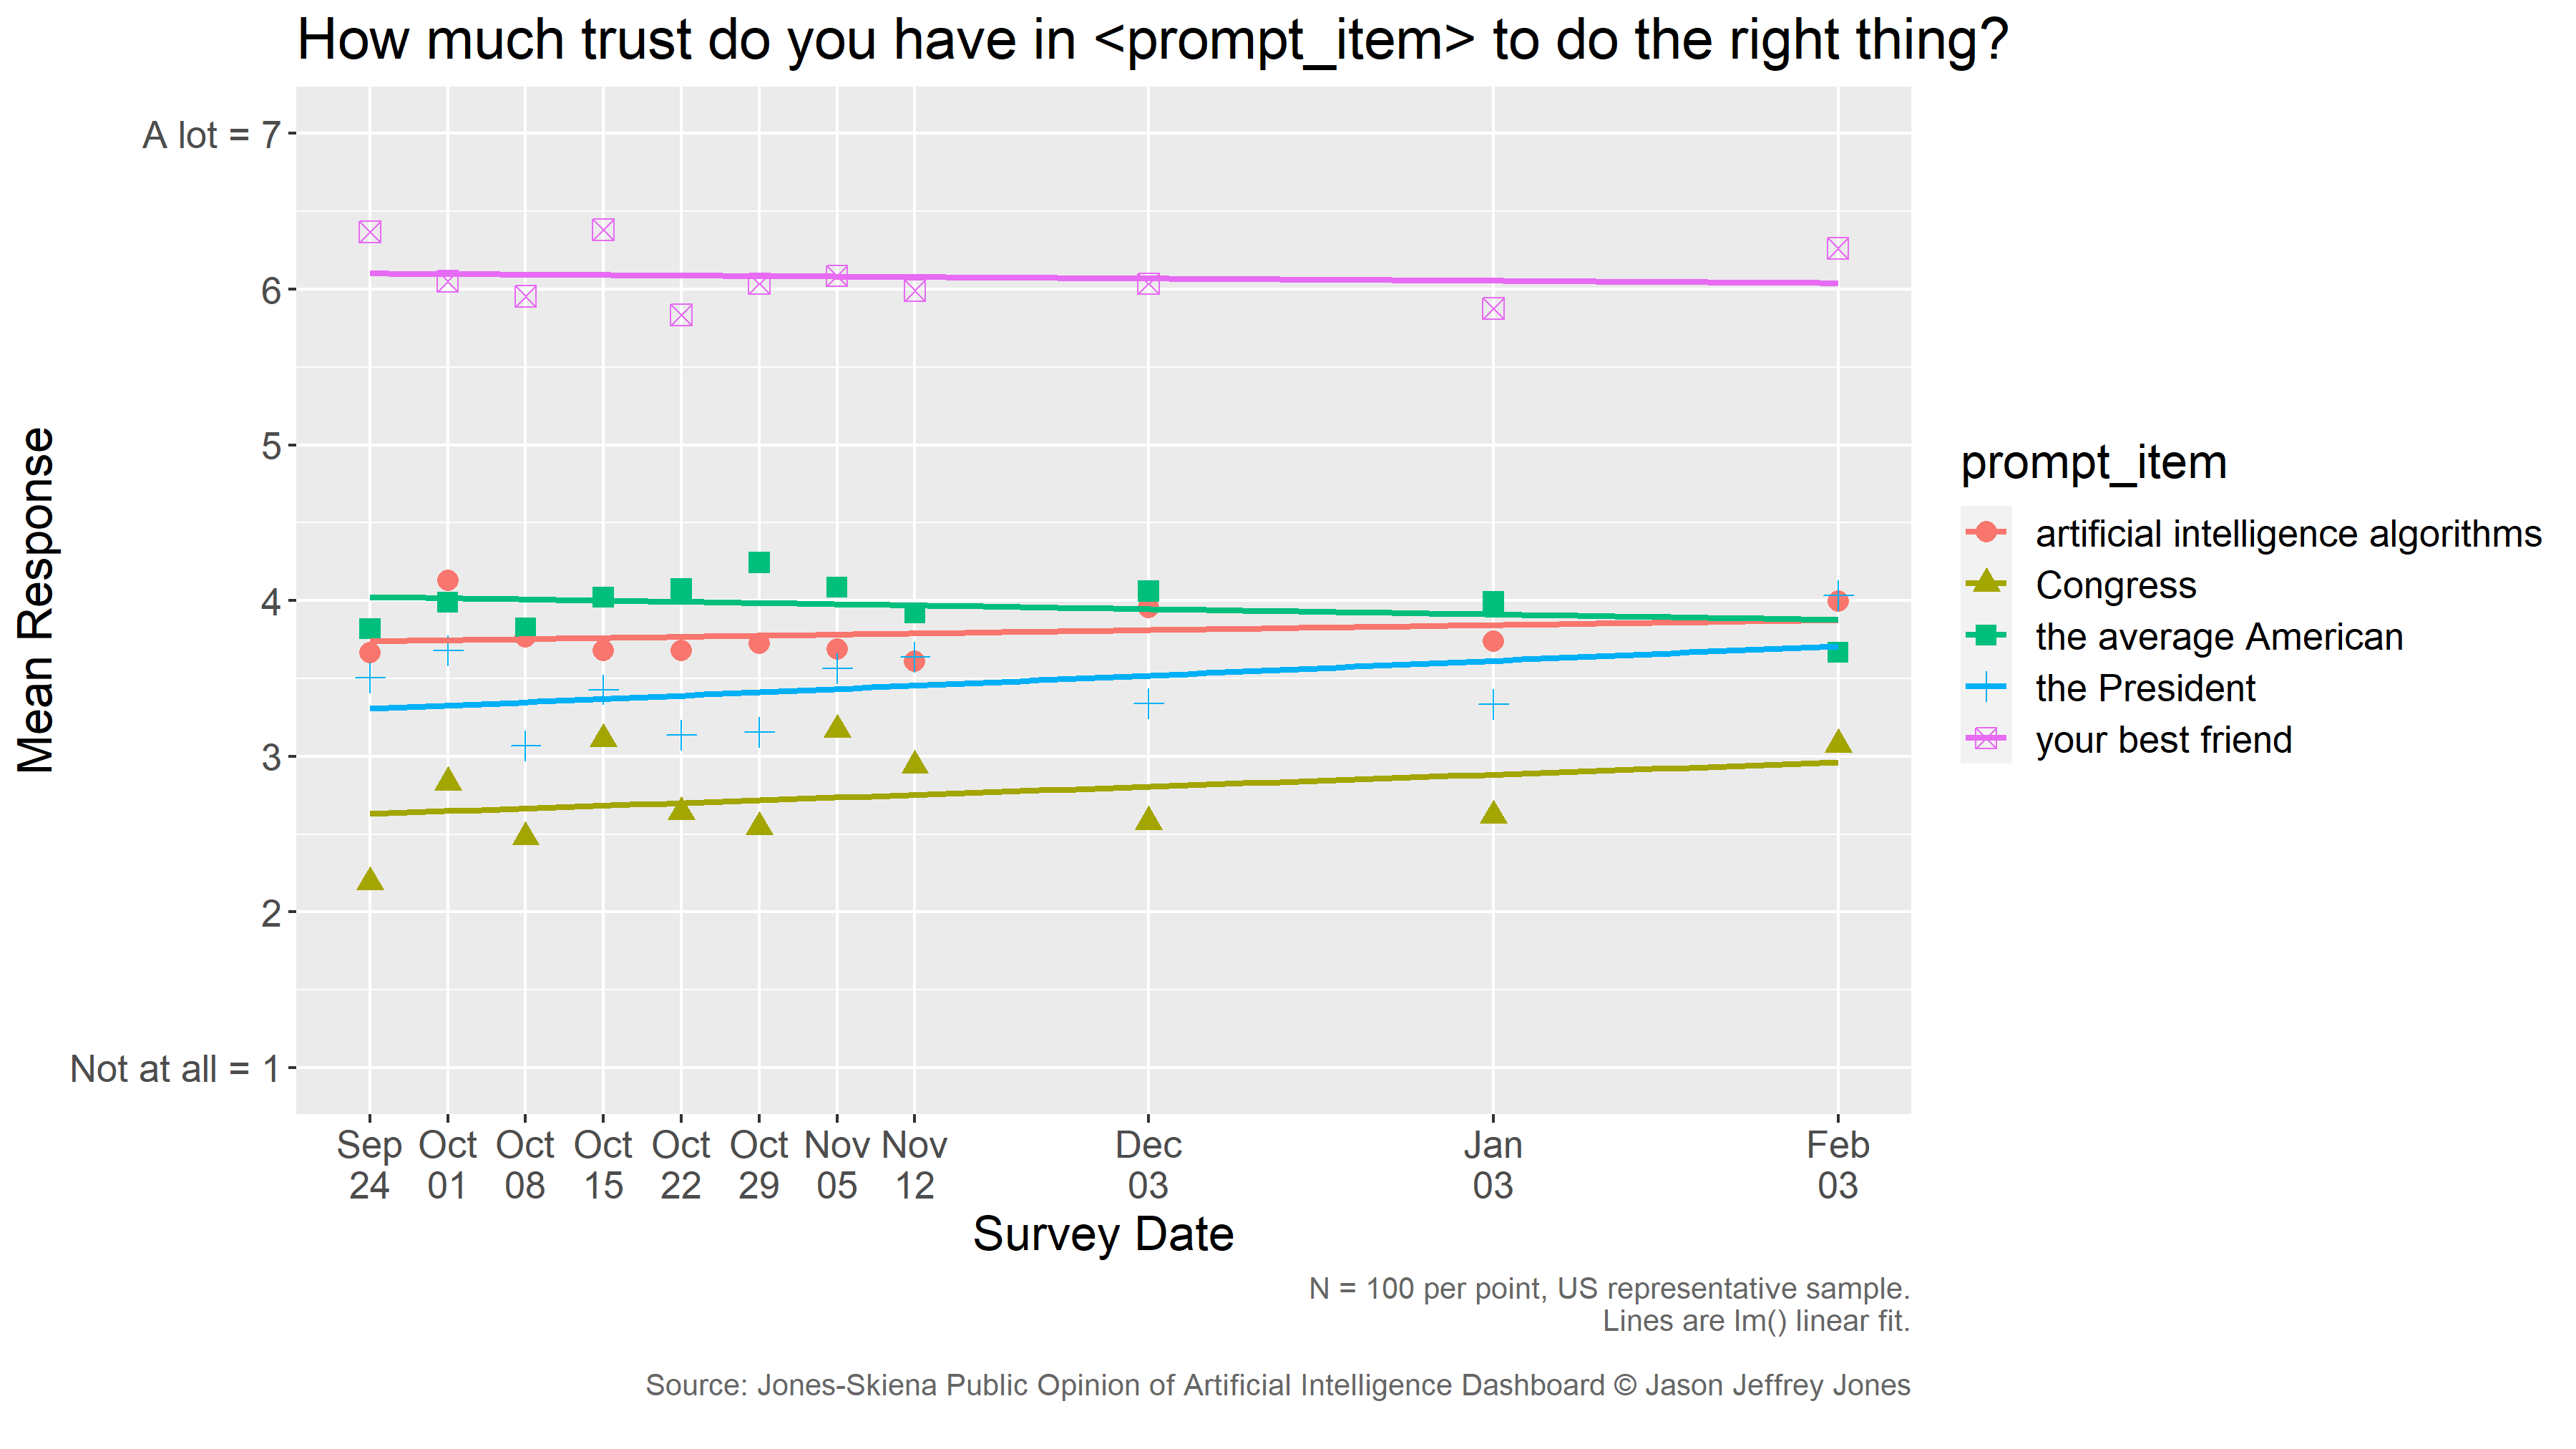
Interpretation
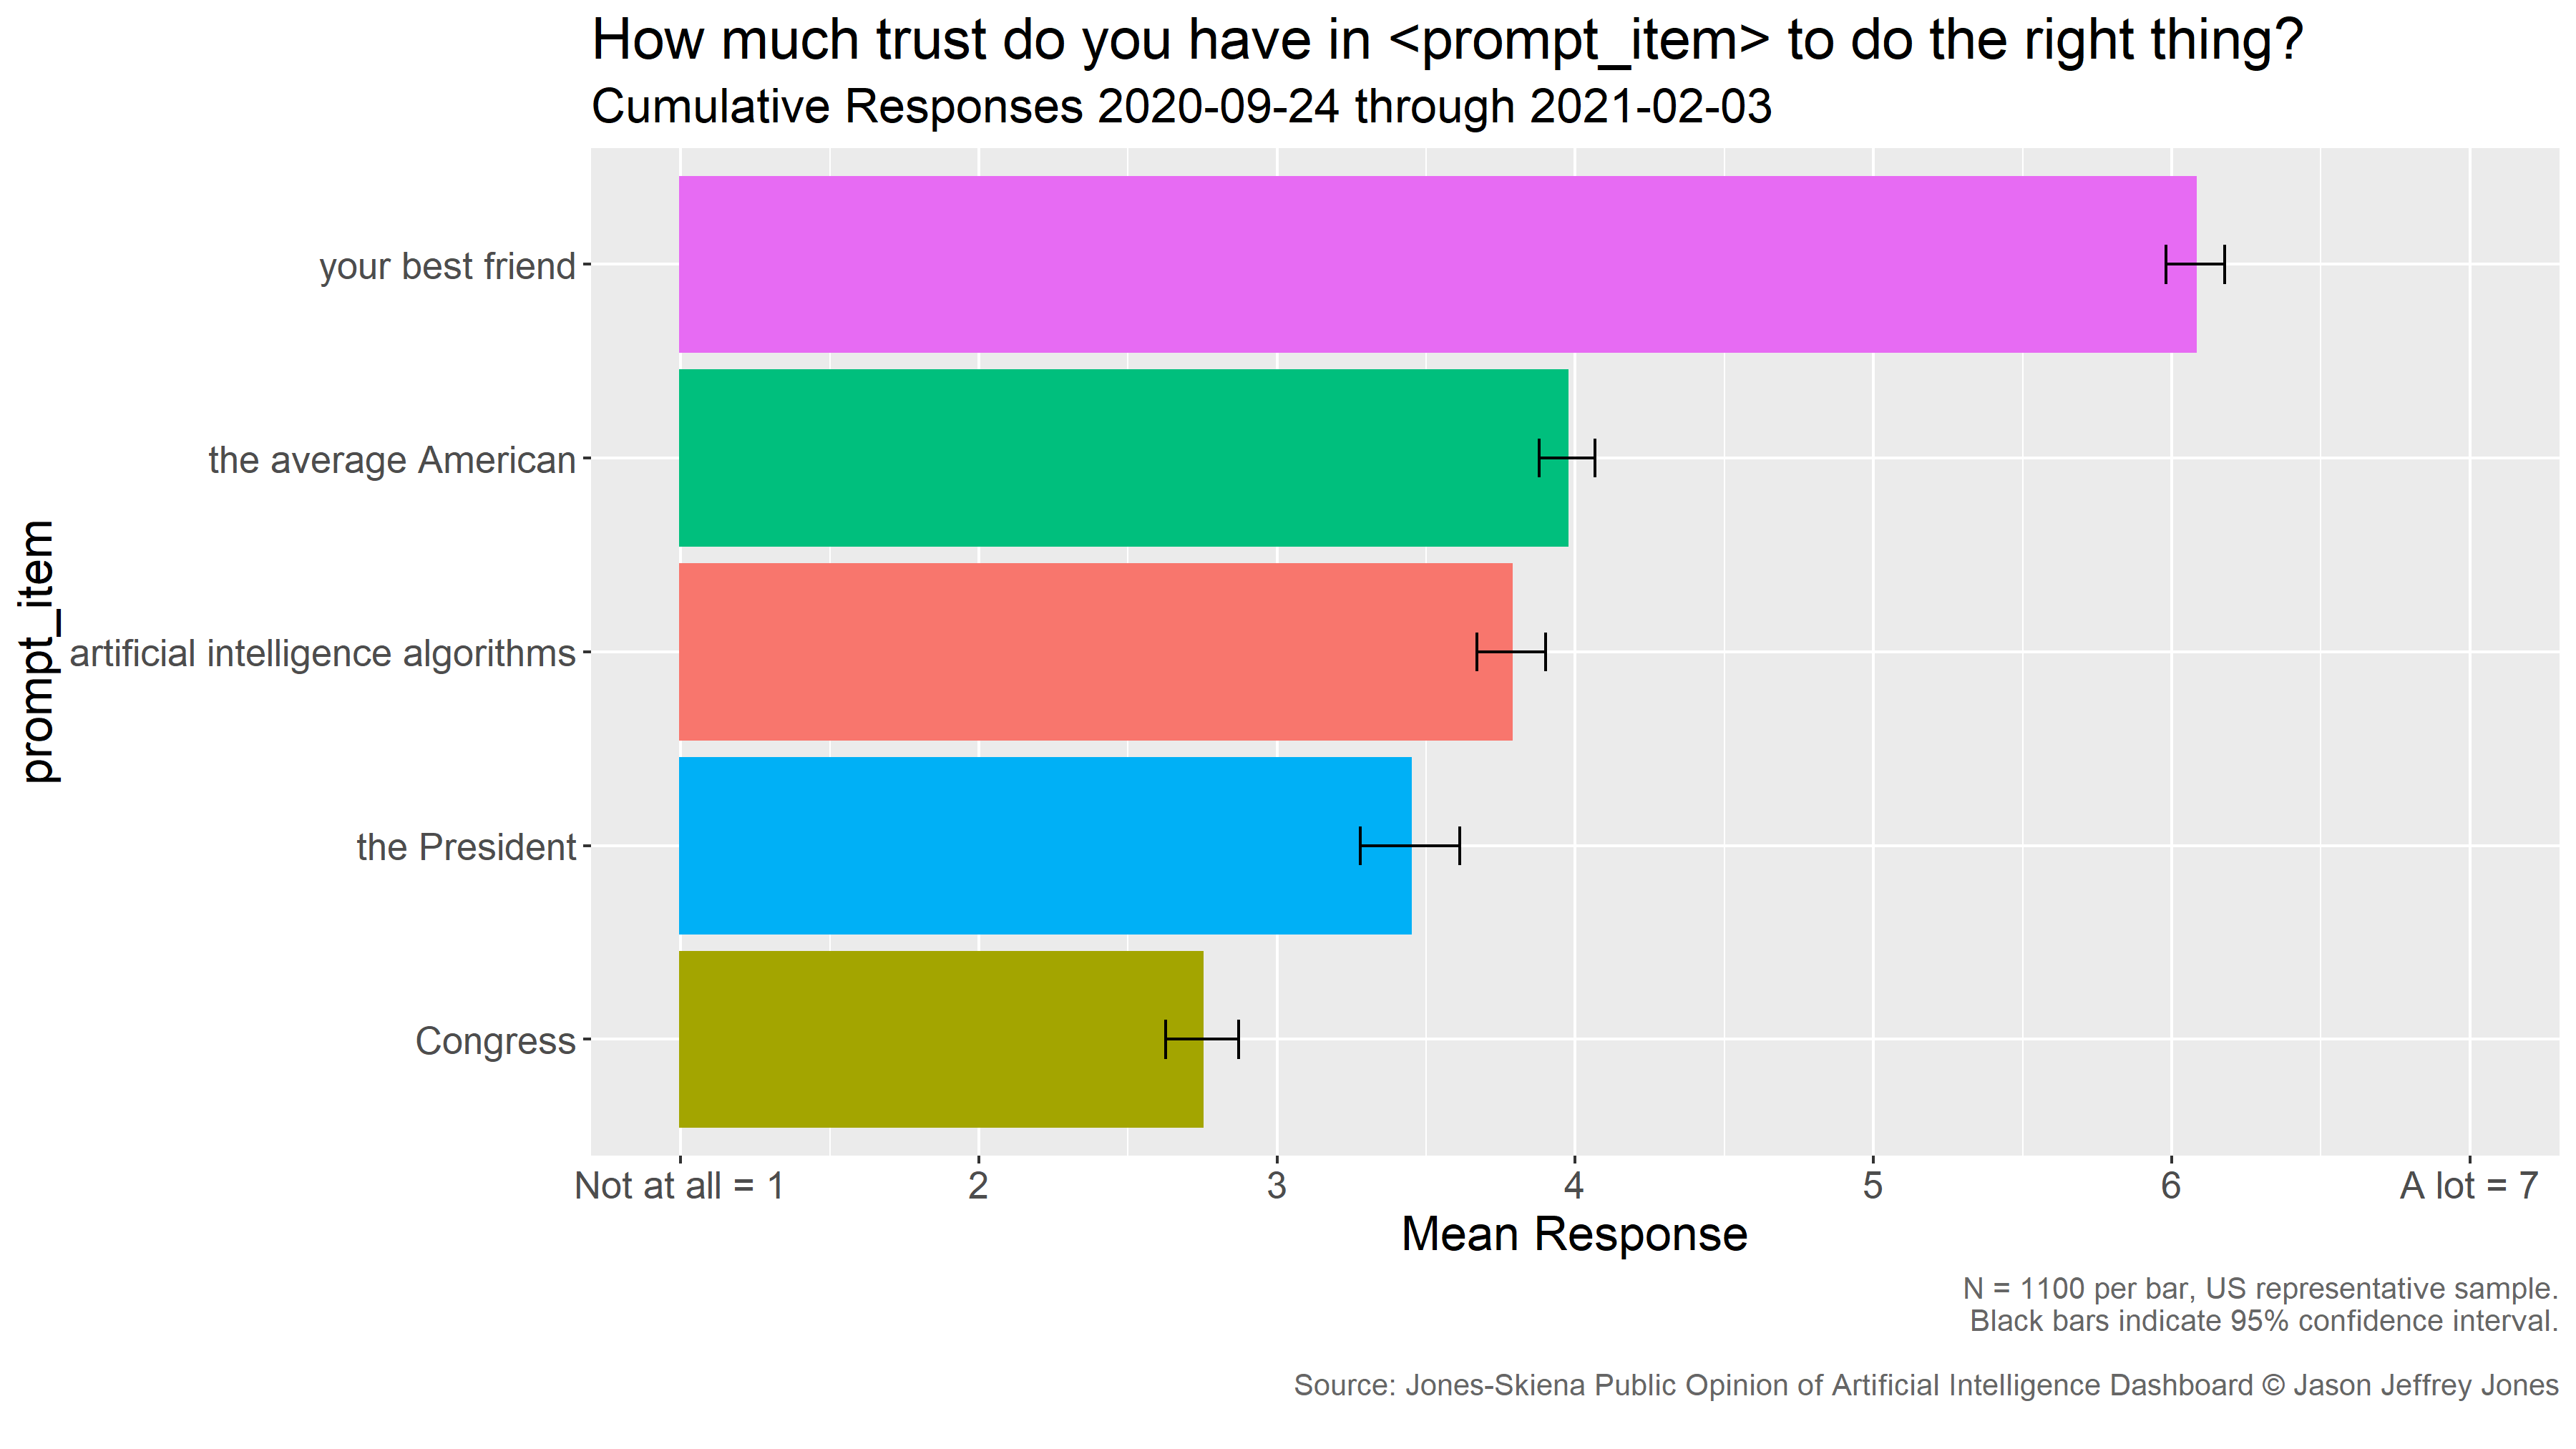
On average, the American public trusts "artificial intelligence algorithms" to do the right thing just a little less than they trust the average American. Americans trust artificial intelligence algorithms more than Congress or the President, but not as much as their best friend. Pooling the data and weighting to match demographics, we may estimate the following 95% confidence intervals.
If you were thinking that these trust survey items would have interesting distributions, you'd be right.
During the period of observation, the magnitude and ordering of trust in these targets has remained stable. Trendlines are shown to aid the eye, but no trendline has a slope significantly different from zero. *
* A lot has happened in Washington, D.C. since the inception of our survey. This round of "trust" items is the first collected after the 2021 storming of the United States Capitol (which occurred Jan 6). A new Congress has been sworn in. A new President has been inaugurated. Respondents granted the new President and Congress some of the highest levels of trust we have seen, and time will tell whether an upward reset or trend holds. The convergence of the trendlines for "the Average American" and "artificial intelligence algorithms" is also interesting to observe.
These surveys are conducted by Dr. Jason Jeffrey Jones and Dr. Steven Sol Skiena. All raw data is available at this Open Science Foundation repository. Please include proper attribution any time you make use of our work. Read more about the Jones-Skiena Public Opinion of AI Dashboard.