
Active project · Current through September 26, 2026
Many trend estimates.
Not one discovery.
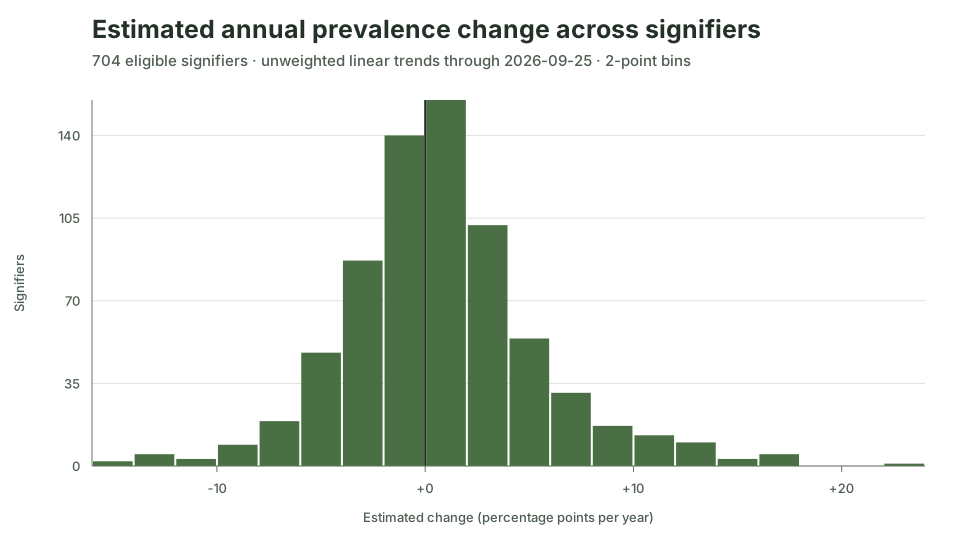
Across 704 eligible identity signifiers, most annualized sample trends cluster near zero. The most dramatic point estimates are leads to monitor—not findings that survive screening across all 704 tests.
Prepared by Ceetown from the public Ipseity Daily microdata through September 25, 2026.
Read the full report · Short report (PDF) · Project blog · Data and code
The public system was healthy at today’s sampled moment. The homepage and canonical file returned HTTP 200, and the gzip parsed cleanly with 716,237 Yes/No answers, 5,059 hashed respondents, and 707 signifiers. The newest response date was one day behind the check. See the monitoring record.
Eleven checks are encouraging, not an uptime estimate. Every sampled check since September 16 found the page and file available, parseable, and one day behind, while the file gained 16,402 observations. Daily snapshots cannot reveal interruptions between checks. Distinguish snapshots from continuous telemetry.
The typical estimated trend is small. Among 704 eligible signifiers, the median annualized slope is +0.5 percentage points and the middle half ranges from -1.9 to +3.0 points. These are unweighted response-sample descriptions. Read the estimand.
The leaderboard is not a discovery list.
beautifulhas the largest positive point estimate (+24.0 points/year), andstar wars fanthe most negative (-14.2). None of 704 trends passes either the 5% Benjamini–Hochberg or Bonferroni screen. See estimates and multiplicity.Adjustment changes magnitudes. All 20 selected leader slopes keep their direction after adjustment for recorded age, sample composition, weekday, and month, but the median absolute shift is 5.3 points/year. The adjustment cannot address unobserved composition or make the sample representative. Compare robustness diagnostics.
A linear trend need not describe a steady path. Only seven of 20 selected raw four-period trajectories move in the selected direction across all three adjacent transitions. Standardization frequently changes which transition looks largest. Inspect the time-shape result.
Pooled trends and within-person trends answer different questions. Only 12 of 20 selected within-respondent slopes retain the original all-response direction, with small repeat samples. This is a warning about estimands, not proof that either comparison recovers population change. Keep the inference bounded.
Source: Jones, J. J. (2026). Ipseity Daily data [Data set]. Zenodo. https://doi.org/10.5281/zenodo.22636514. Full methods and APA references appear in the full report.