Ipseology
using large datasets
and computational methods
There are more self-described vegans than vegetarians among US users of Twitter
Estimating prevalence at annual resolution of vegan and vegetarian in profile bios
2022-10-28
With World Vegan Day approaching, I wondered how many people choose to describe themselves as vegan. And when I say "people," usually I mean US users of Twitter. I also wondered how many people (ahem) describe themselves as vegetarian, but I guess I missed World Vegetarian Day.
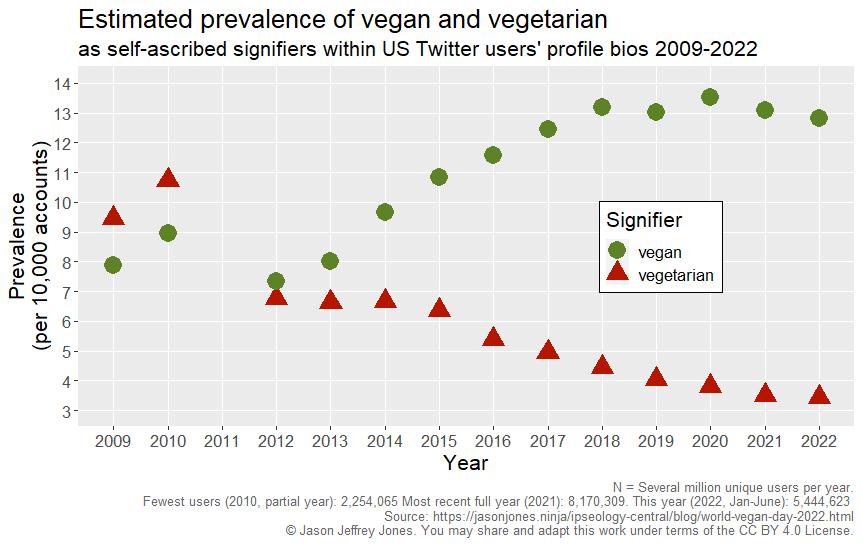
This is a very simple graph, but 109,056,828 observations are summarized here:
What does it mean?
This visualization tells a very simple story. In the past, people* were more likely to describe themselves as vegetarian than vegan, but that is no longer true.
* Remember that people in this context means yearly-active US Twitter users, as I observed them through the Twitter 1% sample stream. Would you like to know more?
In 2009 and 2010, there were approximately 20% more vegetarians than vegans in my samples. In 2011 (unfortunately) I do not have data. By 2012, vegans (7.4 per 10,000) slightly outnumbered vegetarians (6.8 per 10,000). From that point forward, the gap grew due to both an increasing proportion of vegans and decreasing proportion of vegetarians. In the first six months of 2022, almost four times as many users self-described as vegans versus vegetarians.
Ok, cool I guess. What's up with 2009-2010?
In previous work, my time series have begun in February 2015. That is when I started continuously observing the Twitter 1% sample stream. This blog post is the first time I am using additional data collected from elsewhere. The 2009 and 2010 come from one archive and 2012-2014 data come from another. Unfortunately, my interpolated vegan-vegetarian crossover comes between datasets and within the year of missing data.
I'm still getting to know the 2009-2010 data. These prevalence estimates for vegan and vegetarian seem reasonable to me. They are the right order of magnitude, at least. But let's say you are skeptical. Look at the graph then, and block out the 2009 and 2010 data points with your thumb. Now backstrapolate (or hindcast, if you prefer) backwards from 2012. If you trust only the 2012-2022 (or even just the 2015-2022 data), it still seems reasonable to extend the trend backward in time and assume there was once a time when vegetarian was king and vegan second fiddle.
Ipseology - Read and explore more
I think temporal trends in personally expressed identity are interesting, and I show these data here in case others do, too. If this post intrigued you, check out more ipseology:
- Search for trends on any set of words: Jason J. Jones Identity Trends V1
- Read a peer-reviewed, open-access research article about the methods: A dataset for the study of identity at scale: Annual Prevalence of American Twitter Users with specified Token in their Profile Bio 2015–2020
- Read a peer-reviewed, open-access research article about political words: Using Twitter Bios to Measure Changes in Self-Identity: Are Americans Defining Themselves More Politically Over Time?
- Read a blog post about pronoun lists within US Twitter users' bios: 2022 International Pronouns Day and Twitter Visibility
- Quickly get familiar with ipseology terminology: Ipseology Glossary