Ipseology
using large datasets
and computational methods
When did US Twitter reach Peak MAGA? 2020 by my estimation.
US Twitter users decreasingly introject Trump into their identity.
2022-11-03
Peak oil is the hypothetical point in time when the maximum rate of global oil production is reached, after which it is argued that production will begin an irreversible decline.
Has the United States reached Peak MAGA? Peak MAGA is like peak oil. The idea is that there comes a time when all the best sources are tapped; there's no more increase in supply to be had. After that point, the oil (or the Trump support) doesn't vanish. It just gets harder to find, and the rate at which it gushes never again reaches the high point of the boomtime.
We would know Peak MAGA if we saw it. Peak MAGA would look like a turning-around, an inflection point on a graph.
In this blog post, I will argue we've seen it. Skip to that part, please. ⬇️
I'll note several cautions here. Add your own as you like. Peak MAGA and peak oil are not perfectly analogous. Unlike oil, Trump supporters are not primordial underground unthinking sludge. They are people who may change their affiliations, identities and explict expressions of such according to their own reasoning. Note that Peak X is based on the assumption there is some finite amount of X. It's not necessarily reasonable to assume political support for anyone is a finite, depletable resource. Nor that supply couldn't increase again to new highs after a momentary dip. Like peak oil, peak MAGA has been erroneously predicted or declared many times in the past. Lastly, I am confining the remaining discussion to the US Twitter population, which does not map one-to-one with the populations of US citizens or voters.
Quick Methods and Theory
I think about Peak MAGA the same way I think about everything: in terms of Twitter profile biographies. Twitter profile biographies (bios) are short, self-authored, self-descriptive texts. They are responses to the prompt Describe yourself in 160 characters or less. They are the perfect source of personally expressed identity data.
One thing people sometimes do when they write their own bio is talk about others. Specifically, they include proper nouns denoting others in this brief self-description. Within bios one finds the names of schools, companies, politicians, actors and musicians. I call this conscious introjection. (In its original, Freudian definition, introjection is strictly an unconscious act.) I hypothesize conscious introjection is strategic. A single name brings with it a host of associations, and users choose to include names in their bios to efficiently communicate within the tight constraint of 160 characters.
No one gets consciously introjected like Donald Trump. At one point, more US Twitter users mentioned Trump than Jesus in their bio. I'll also show data for MAGA in the bio, because it seems like another way to communicate a very similar set of associations.
About the Peak MAGA in 2020 thing?
Oh, did you want to see a graph? Maybe a graph based on 9 million or so unique profiles per year that showed what proportion contained Trump or MAGA would be good. Let's take a look now.
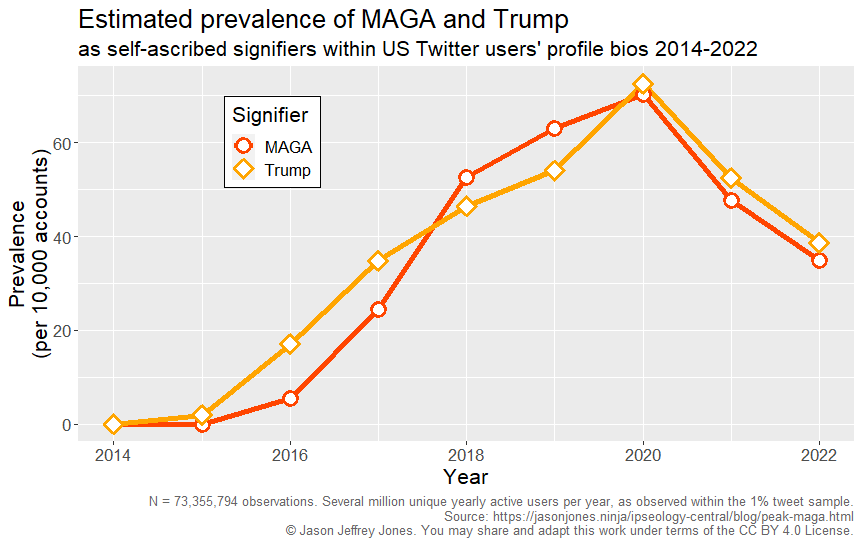
It's beautiful to me how easy social science can be when you measure the same thing consistently, persistently and precisely. In the US Twitter population, conscious introjection of Trump and MAGA reached its highest prevalence in 2020.
Keep in mind this data is cross-sectional. The recent decreasing prevalence of profiles containing Trump or MAGA in the bio could be due to:
- Those users became less active (i.e. tweeted less) in 2021 and 2022.
- Twitter (the company) took actions (suspensions/filtering) that made those users less visible in the 1% sample stream.
- Users who did not have
TrumporMAGAin the bio became more active (i.e. tweeted more) in 2021 and 2022. - Users deleted
TrumpandMAGAfrom their bios.
What I can say for sure is that I kept the code for observing, classifying and counting exactly the same, and the data show a rising trend in prevalence 2014-2020 followed by an inflection point and decline.
An Elephant in the Room
You're thinking that the above graph and discussion omit an important event. What about the January 6, 2021 attack on the US Capitol? That's an excellent question, and it brings me to the point of writing this piece.
The results here are cross-sectional, at annual resolution and casually presented. As a complement, it would be fascinating to read a formal, longitudinal causal analysis at daily resolution surrounding the January 6 event. Thankfully, an amazing, peer-reviewed, open-access research article that does just that was recently published.
Read Do Violent Protests Affect Expressions of Party Identity? Evidence from the Capitol Insurrection by Gregory Eady, Frederik Hjorth and Peter Thisted Dinesen!
Ipseology - Read and explore more
I think temporal trends in personally expressed identity are interesting, and I show these data here in case others do, too. If this post intrigued you, check out more ipseology:
- Read a peer-reviewed, open-access research article about the methods: A dataset for the study of identity at scale: Annual Prevalence of American Twitter Users with specified Token in their Profile Bio 2015–2020
- Search for trends on any set of words that interest you: Jason J. Jones Identity Trends V1
- Read a peer-reviewed, open-access research article about political words: Using Twitter Bios to Measure Changes in Self-Identity: Are Americans Defining Themselves More Politically Over Time?
- Read a preprint about US Twitter users' use of 🇺🇦 within their names and bios: Exploring Identity Activism in Support of Ukraine via the Ukraine Flag Emoji on Twitter
- Quickly get familiar with ipseology terminology: Ipseology Glossary